0%

一、Overview

[Kaggle竞赛地址](ML2021Spring-hw2 | Kaggle)

竞赛内容:根据声音 frame 预测 phoneme 的类别(39分类问题)

训练数据格式:1229932 × 429,此处将前后五个frame连接在一起,可以更好地预测当前的类别

测试数据格式:451552 × 429

二、Strong Baseline

暂时没有过 StrongBaseline

  • 训练集重采样

    训练集类别之间数量差异极大,类别最高的数量可达178713,而最低的类别只有3883。在验证集上验证时这些低数据量的类别预测率普遍低于高数据量的样本,这里将每个类别数量都拓展到15000。修改后低数据量类别预测率显著提高,但总体预测率并未有明显提高,可能测试集中的低数据量类别的样本也同样少。

    1
    2
    3
    4
    5
    6
    7
    8
    9
    10
    11
    12
    13
    14
    train_class = []
    class_idx = np.arange(train_x.shape[0])
    for i in range(39):
    train_class.append(class_idx[train_y == str(i)])

    min_num = 15000
    for i in range(39):
    addition = min_num - vote[str(i)]
    if addition <= 0:
    continue
    print(i, addition)
    idx = np.random.choice(train_class[i], addition)
    train_x = np.vstack([train_x, train_x[idx]])
    train_y = np.append(train_y, train_y[idx])
  • 增大网络模型

    1
    2
    3
    4
    5
    6
    7
    8
    9
    10
    11
    12
    13
    14
    15
    16
    17
    18
    19
    20
    21
    22
    23
    24
    25
    26
    27
    28
    29
    30
    31
    32
    33
    34
    35
    36
    37
    38
    39
    40
    41
    42
    43
    44
    45
    46
    47
    48
    49
    50
    51
    52
    53
    54
    55
    56
    57
    58
    59
    class Classifier1(nn.Module):
    def __init__(self):
    super(Classifier1, self).__init__()
    self.dropout = nn.Dropout(0.5)

    self.layer1 = nn.Linear(429, 2048)
    self.layer2 = nn.Linear(2048, 2048)
    self.layer3 = nn.Linear(2048, 2048)
    self.layer4 = nn.Linear(2048, 1024)
    self.layer5 = nn.Linear(1024, 512)
    self.layer6 = nn.Linear(512, 128)

    self.BatchNorm0 = nn.BatchNorm1d(429)
    self.BatchNorm1 = nn.BatchNorm1d(2048)
    self.BatchNorm2 = nn.BatchNorm1d(2048)
    self.BatchNorm3 = nn.BatchNorm1d(2048)
    self.BatchNorm4 = nn.BatchNorm1d(1024)
    self.BatchNorm5 = nn.BatchNorm1d(512)
    self.BatchNorm6 = nn.BatchNorm1d(128)

    self.out = nn.Linear(128, 39)
    self.act_fn = nn.LeakyReLU()

    def forward(self, x):
    x = self.BatchNorm0(x)

    x = self.layer1(x)
    x = self.act_fn(x)
    x = self.BatchNorm1(x)
    x = self.dropout(x)

    x = self.layer2(x)
    x = self.act_fn(x)
    x = self.BatchNorm2(x)
    x = self.dropout(x)

    x = self.layer3(x)
    x = self.act_fn(x)
    x = self.BatchNorm3(x)
    x = self.dropout(x)

    x = self.layer4(x)
    x = self.act_fn(x)
    x = self.BatchNorm4(x)
    x = self.dropout(x)

    x = self.layer5(x)
    x = self.act_fn(x)
    x = self.BatchNorm5(x)
    x = self.dropout(x)

    x = self.layer6(x)
    x = self.act_fn(x)
    x = self.BatchNorm6(x)
    x = self.dropout(x)

    x = self.out(x)

    return x
  • 使用l2正则

1
2
# l2正则即在loss中添加|w|^2,控制w的大小,求导后本质上等同于weight_decay
optimizer = torch.optim.Adam(model.parameters(), lr=learning_rate, weight_decay=1e-4)
  • 后处理(提升明显)

    音频信号是连续的,而frame的长度只有25ms,因此一个单词往往会对应多个frame,这些frame都是连续的且类别相同。

    1
    2
    3
    4
    5
    6
    7
    8
    9
    10
    11
    # 11 3 11 -> 11 11 11
    count = 0
    for i in range(1, len(predict)-1):
    previous_ = predict[i-1]
    next_ = predict[i+1]
    current_ = predict[i]
    if (previous_ != current_) and (next_ != current_) and (previous_ == next_):
    predict[i] = previous_
    count +=1

    print('total number of correction %d, correction percent %.2f'% (count, count/len(predict)))

    image

猜测要使用lstm,gru等语言类模型或训练多个模型进行ensemble

一、Overview

[Kaggle竞赛地址](ML2021spring - hw3 | Kaggle)

竞赛内容:根据食物图片进行分类(11分类)

训练数据格式:3190 张有标签数据,6786 张无标签数据,660张验证集数据

测试数据格式:3347 张

二、Strong Baseline

暂时没有过 StrongBaseline

  • 修改模型

    1
    2
    # 如果使用预训练模型就能轻松过StrongBaseline了
    model = torchvision.models.resnet18(pretrained=False).to(device)
  • 图像增广

    1
    2
    3
    4
    5
    6
    7
    8
    9
    10
    11
    12
    13
    14
    15
    # 由于此次训练数据极少,图像增广就显得十分重要
    # 经测试只进行简单的图像增广(翻转旋转)对结果没有很大的影响
    # 所以此处使用较为复杂的transform来扩充测试集
    train_tfm = transforms.Compose([
    # Resize the image into a fixed shape (height = width = 128)
    transforms.Resize((width, width)),
    transforms.RandomChoice(
    [transforms.AutoAugment(),
    transforms.AutoAugment(transforms.AutoAugmentPolicy.CIFAR10),
    transforms.AutoAugment(transforms.AutoAugmentPolicy.SVHN)]),
    transforms.RandomHorizontalFlip(p = 0.5),
    transforms.ColorJitter(brightness=0.5),
    transforms.RandomAffine(degrees=20, translate=(0.2, 0.2), scale=(0.7, 1.3)),
    transforms.ToTensor(),
    ])
  • 半监督学习

    使用当前训练的模型给没有的标签的图像打上标签加入到训练集当中

    1
    2
    3
    4
    5
    6
    7
    8
    9
    10
    11
    12
    13
    14
    15
    16
    17
    18
    19
    20
    21
    22
    23
    24
    25
    26
    27
    28
    29
    30
    31
    32
    33
    34
    35
    36
    37
    38
    39
    40
    41
    42
    43
    # 没有标签的图像是有标签图像的两倍有余,如果想要过 strong baseline,这些数据是必不可少的
    # 训练刚开始的时候正确率太低不能直接开启半监督学习,否则会适得其反
    # 当模型在验证集上的预测率达到70%时就启用半监督学习

    def get_pseudo_labels(dataset, model, threshold=0.8):
    # This functions generates pseudo-labels of a dataset using given model.
    # It returns an instance of DatasetFolder containing images whose prediction confidences exceed a given threshold.
    # You are NOT allowed to use any models trained on external data for pseudo-labeling.
    device = "cuda" if torch.cuda.is_available() else "cpu"

    # Construct a data loader.
    data_loader = DataLoader(dataset, batch_size=batch_size, shuffle=False)

    # Make sure the model is in eval mode.
    model.eval()
    # Define softmax function.
    softmax = nn.Softmax(dim=-1)

    idx = []
    labels = []

    # Iterate over the dataset by batches.
    for i, batch in enumerate(data_loader):
    img, _ = batch

    # Forward the data
    # Using torch.no_grad() accelerates the forward process.
    with torch.no_grad():
    logits = model(img.to(device))

    # Obtain the probability distributions by applying softmax on logits.
    probs = softmax(logits)

    # ---------- TODO ----------
    # Filter the data and construct a new dataset.
    for j, x in enumerate(probs):
    if(torch.max(x) >= threshold):
    idx.append(i * batch_size + j)
    labels.append(int(torch.argmax(x)))
    # # Turn off the eval mode.
    model.train()
    dataset = PseudoDataset(Subset(dataset, idx), labels)
    return dataset

已经train了500轮,距离 strong baseline 还差3%

image

Vector

1
2
3
4
5
6
7
8
9
10
11
12
13
14
15
vector<int> a(n, x); 	// 创建长度为n,填充为x的数组a(x不写则为0)
a.size();a.empty();
a.clear();
a.front();a.back();
a.push_back();a.pop_back();
a.begin();a.end();
a.erase(a.begin(), a.begin()+n);
a.resize(m);

// vector可以根据字典序进行比较
vector<int> a(10, -3);
vector<int> b(9, 2);
if(a < b){
cout << "a < b";
}

Pair

1
2
3
4
// 支持比较,以first为第一关键字,second为第二关键字
pair<int, int> p;
p = {1, 2};
p.first;p.second;

String

1
2
3
4
5
6
7
8
9
10
11
12
13
string str;
str.erase(i, j); // [i, j)
str.replace(i, n, s); //[i, i+n)

#include <string>
tolower(str[i]);
toupper(str[i]);

str.find(s, st); // [st, )
str.substr(i, n); // [i, i+n)
str.insert(str.begin(), x);
str.clear();
printf("%s\n%s", a, a.c_str()); // %s是从字符串首地址输出到\0为止,因此直接输出a是错误的

Queue

1
2
3
4
queue<int> q;
q.size();q.empty();
q.front();q.back();
q.push();q.pop();

Priority_Queue

1
2
3
4
5
6
7
8
9
// 默认构造大根堆
priority_queue<int> heap;
heap.push(x);
heap.top();
heap.pop();

// 若想使用小根堆
// 1. 直接插入-x
// 2. priority_queue<int, vector<int>, greater<int>> heap;

Stack

1
2
3
4
stack<int> q;
q.size();q.empty();
q.push(x);q.pop();
q.top();

Deque

1
2
3
4
5
6
7
deque<int> q;
q.size();q.empty();
q.front();q.back();
q.push_back(x);q.pop_back();
q.push_front(x);q.pop_front();
q.begin();q.end();
q.clear();

set, map, multiset, multimap基于平衡二叉树(红黑树),插入删除都是O(logn)

Set/Multiset

1
2
3
4
5
6
7
8
9
10
// set中元素不重复,multiset可重复
size();empty();
clear();
insert(x);find(x);
count(x); // 返回一个数的个数
erase();
// 1. 若输入的是数x,则删除所有x,O(logn + k),k为x的数量
// 2. 若输入的是迭代器,则删除这个迭代器
lower_bound(x); // 返回大于等于x的最小的数的迭代器
upper_bound(x); // 返回大于x的最小的数的迭代器

Map/Multimap

1
2
3
4
5
6
7
8
9
size();empty();
clear();
insert(x);find(x); // 参数是pair
count(x); // 返回一个数的个数
erase();
// 1. 若输入的是数x,则删除所有x,O(logn + k),k为x的数量
// 2. 若输入的是迭代器,则删除这个迭代器
lower_bound(x); // 返回大于等于x的最小的数的迭代器
upper_bound(x); // 返回大于x的最小的数的迭代器

unordered_set, unordered_map, unordered_multiset, unordered_multimap基于哈希表,插入删除都是O(1),不支持lower_bound()和upper_bound()

Bitset

1
2
3
4
5
6
7
8
9
bitset<10000> s;	// 类型是大小
s[1]; // 查看第二位
s.count(); // 返回有几个1
s.any(); // 是否有1
s.none(); // 是否全为0
s.set(); // 将所有位置为1
s.reset(); // 将所有位置为0
s.set(k, v); // 将第k+1位置为v
// 支持~^&|等操作,将s看成一个数

1、决策树(Decision Tree)

决策树(decision tree)是一类常见的机器学习方法,就如同它的名字一般,训练过程类似一个树形结构,树上的每个非叶子节点都是 某种属性测试,每个分支代表了对该属性测试的输出,而叶子节点存储的就是决策结果根节点代表样本全集)。

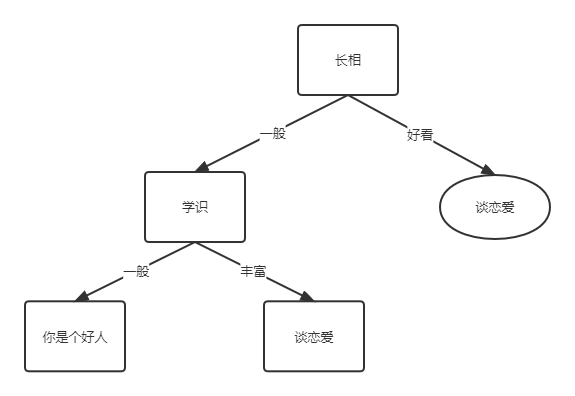
上述概念性的语句可能会比较晦涩,不过决策树的思想体现在日常生活中的方方面面,下图应该可以给你一个较为直观的感受。

未命名文件 (1)

上图简化了==大概是==谈恋爱时的决策思路,第一印象外貌,这部分的比重应该是比较大的,可以筛选掉大部分的人,从而降低信息熵(信息熵又是什么?),而后可能虽然没有那么帅气,但在相识一段时间后,发现其学富五车或是被其他什么因素吸引了,也会萌生谈恋爱的想法。如果在彻底观察下来后,结果都不尽人意,那就只能递出好人卡了。

显然,决策树的创建过程应该是一个递归的过程(可能用迭代实现吧),它会一直采用深度遍历的方式进行属性测试,只有在当前节点中所包含的样本都属于同一类别时才会导致递归返回(正常情况下不会这么做)。

2、信息熵(Entropy)

不过,人可以通过某些经验得出一系列的 属性测试,计算机可不行。那么决策树是如何进行 属性测试,又是如何判断该测试的好坏呢?这就要提出由大名鼎鼎的香农提出的香农定理(计网DNA错乱),其实是他老人家在1948年提出的 信息熵 的概念。

简单来说信息熵可以反映某件事不确定的程度,信息熵越高,那我们说这件事就越不确定;反之,信息熵越低,那这件事就越确定。信息熵为0,代表我们完全了解这件事,不确定性为0。下面是信息熵的数学公式。
$$
\begin{gather*}
entropy = -\sum\limits_{i=1}^kp_ilog(p_i)
\end{gather*}
$$
如果是二分类的话,又可以写成
$$
\begin{gather*}
entropy = -plog(p)-(1-p)log(1-p)
\end{gather*}
$$
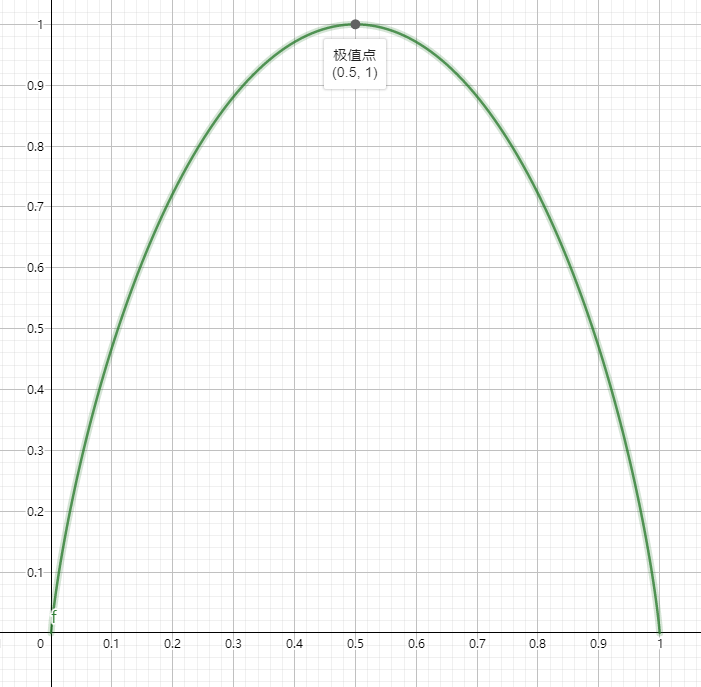
下面是二分类信息熵的函数图像,这里 log 是以 2 为底的,神经网络中一般都是以 e 为底,不过就按我愚见,底数到底取什么值并没有什么太大关系(可能会方便后续数据处理),毕竟函数的性质不会发生改变,包括极值点的位置(横坐标),对称性等,只要能保证在一个系统(程序)中保证统一方便比较就行。

如下图,信息熵的函数图像会比较类似于二次函数抛物线的图像,定义域 (0,1),注意 log 真数要大于 0,但可以利用极限思想得出两个端点值都为 0。整个函数图像在 x = 0.5 除取的最大值,也就是说在二分类的问题下,50% 是不确定性最大的,这也非常好理解, 50% 不会偏向于任意一个类别,我们只能靠猜来得出答案。如果这个概率偏大一点或偏小一点,那么就肯定会偏向于某一类别,不确定性就没有那么大了。

image

现在再回到计算机应该如何评估 属性测试,信息熵就是它的评估指标。我们希望在每次 属性测试 的信息熵都要尽量的低,也就是尽可能地将不同的类别区分开来。而如何得到这个最好的 属性测试 呢?只需要暴力枚举所有特征,根据特征值进行分类就行了,下面是代码的实现。

3、基尼系数(Gini)

另外,除了信息熵函数,还可以用基尼系数来量化不确定性程度。
$$
\begin{gather*}
gini = 1-\sum\limits_{i=1}^kp_i^2
\end{gather*}
$$
同样地,这里也给出二分类下的基尼系数表达式。
$$
\begin{gather*}
gini = 1-p^2-(1-p)^2=-2(p^2-p)
\end{gather*}
$$
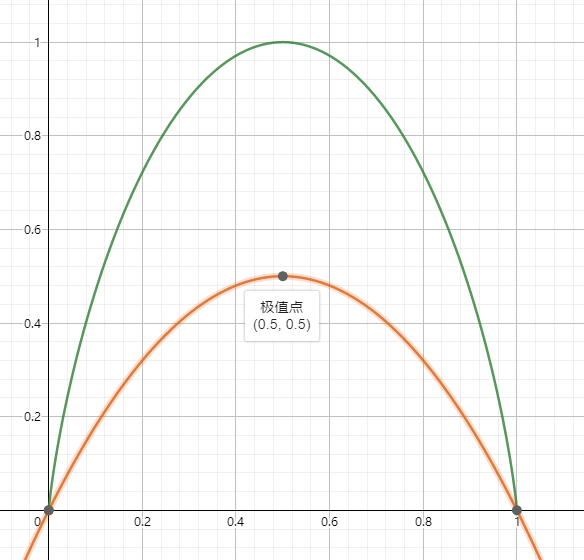
图像如下,橙色的是 gini,绿色的是 entropy,二者的函数的性态非常相似(单调性,对称性,凹凸性,极值点等),因此二者都非常适合描述事物的不确定性程度。

而由于信息熵函数有取对数的操作,比较影响计算效率,因此基尼系数也被 sklearn 中决策树的实现选为默认标准。

image

4、特性(propety)

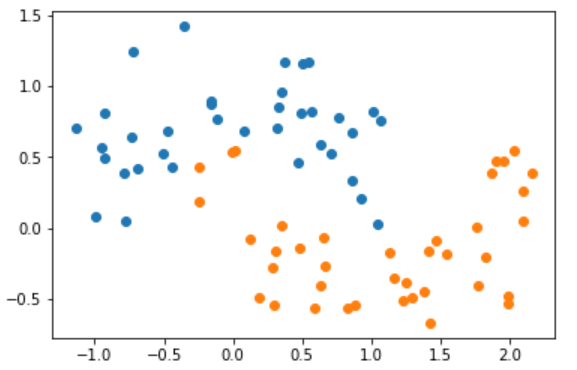
测试集选用的是 sklearn 中自带的月亮函数 make_moons,样本分布如下。

image

先调用库中的决策树类,对该月亮样本进行拟合,然后我们可以绘制其决策边界。

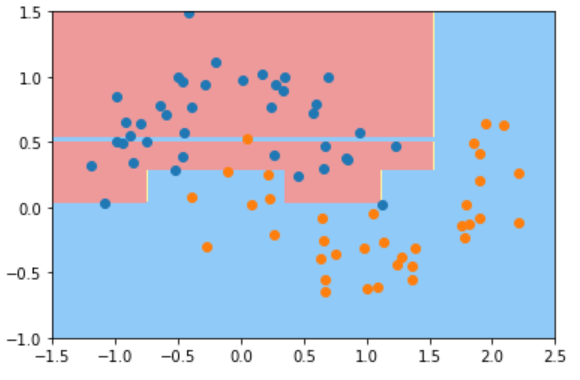
由于决策树天然地容易过拟合(随随便便就能在训练集上获得非常高的预测率),因此在构建模型的时候 sklearn 也是提供了非常多的超参数来控制这个问题。

下图是没设置超参数的情况,决策树会特别容易收到异常值的影响,会为了拟合单独一个或几个点导致其决策边界奇形怪状的。

image

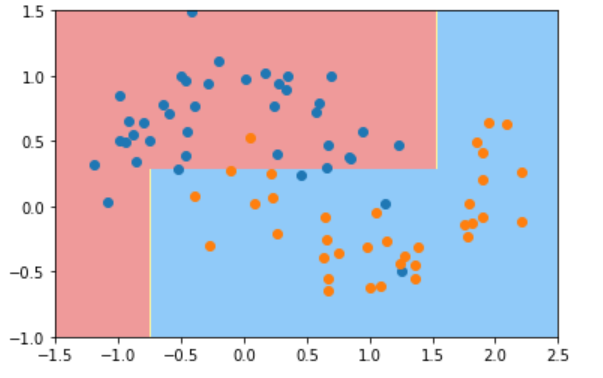
下图将树的最高高度限制在了 2。

image

通过上述两张图可以发现一个比较有意思的事情,决策树的决策边界是横平竖直的,这也是归于他较为独特的训练方法(根据特征值划分左右两份),因此它不可能能拟合出来一条斜线或是曲线(只能拟合出类似楼梯状的决策边界)!

5、代码(Coding)

关于决策树,我这里只实现了部分功能,有关递归建树和预测的代码都没写(不大会)。

1
2
3
4
5
6
7
8
9
10
11
12
13
14
15
16
17
18
19
20
21
22
23
24
25
26
27
28
29
30
31
32
33
34
35
36
37
38
39
40
41
42
43
44
45
46
47
48
49
50
51
52
53
54
55
# 计算信息熵
def getEntropy(y):
n = len(y)
counter = Counter(y)
entropy = 0.
for value in counter.values():
p = value / n
entropy -= p * np.log(p)
return entropy

# d - dimension
# v - value
# 根据特征值将样本划分成大于该特征值或小于等于该特征值的两部分
def split(X, y, d, v):
l_idx = X[:, d] <= v
r_idx = X[:, d] > v
return X[l_idx], X[r_idx], y[l_idx], y[r_idx]

# 划分样本
def decision(X, y):
best_e = float("inf")
best_d = -1
best_v = -1

# 遍历所有特征
for d in range(X.shape[1]):
X_d = X[:, d]
sorted_idx = np.argsort(X_d)
# 遍历特征中所有值,并以此划分样本,寻求最低的信息熵
for i in range(len(y) - 1):
mid = (X_d[i] + X_d[i+1]) / 2
X_l, X_r, yl, yr = split(X, y, d, mid)
entropy = len(yl) / len(y) * getEntropy(yl) + len(yr) / len(y) * getEntropy(yr)
if entropy < best_e:
best_e = entropy
best_d = d
best_v = mid

return best_e, best_d, best_v

# 可视化决策边界
def plot_decision_boundary(model, axis):

x0, x1 = np.meshgrid(
np.linspace(axis[0], axis[1], int((axis[1]-axis[0])*100)).reshape(-1, 1),
np.linspace(axis[2], axis[3], int((axis[3]-axis[2])*100)).reshape(-1, 1),
)
X_new = np.c_[x0.ravel(), x1.ravel()]
y_predict = model.predict(X_new)
zz = y_predict.reshape(x0.shape)

from matplotlib.colors import ListedColormap
custom_cmap = ListedColormap(['#EF9A9A','#FFF59D','#90CAF9'])

plt.contourf(x0, x1, zz, cmap=custom_cmap)

测试一下,我的代码实现和 sklearn 实现的结果是否有差异。数据还是用得前面的月亮样本。

image

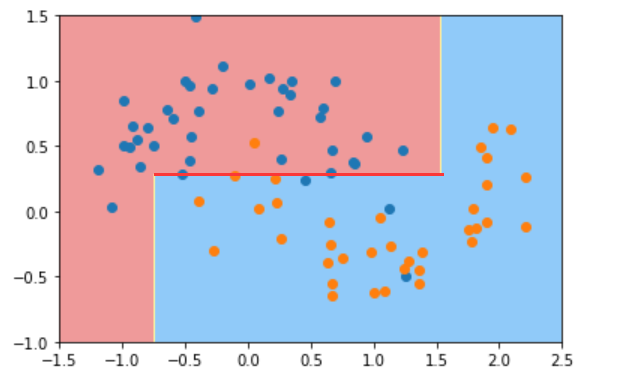
第一次划分在了 特征1,值为 0.27,也就是下图中红线的位置。

image

image

第一次划分后,整个样本就变成上下两部分,后续在分别对这上下两部分再各进行一次划分。可以发现啊,运行的结果都是在x轴上进行了划分,值分别为 -0.681.24,和上图的决策边界也基本一致。

image