0%

网站架构大作业

1. 多项式回归

最近高数刚复习到无穷级数这一章,里面提到了非常多的展开式,即用多项式去近似那些我们不容易求的函数,以此简化对实际复杂问题的计算,sinx 就是其中之一。
$$
\begin{gather*}
sinx = \sum\limits_{n=0}^\infty(-1)^n\frac{x^{2n+1}}{(2n+1)!}
\end{gather*}
$$
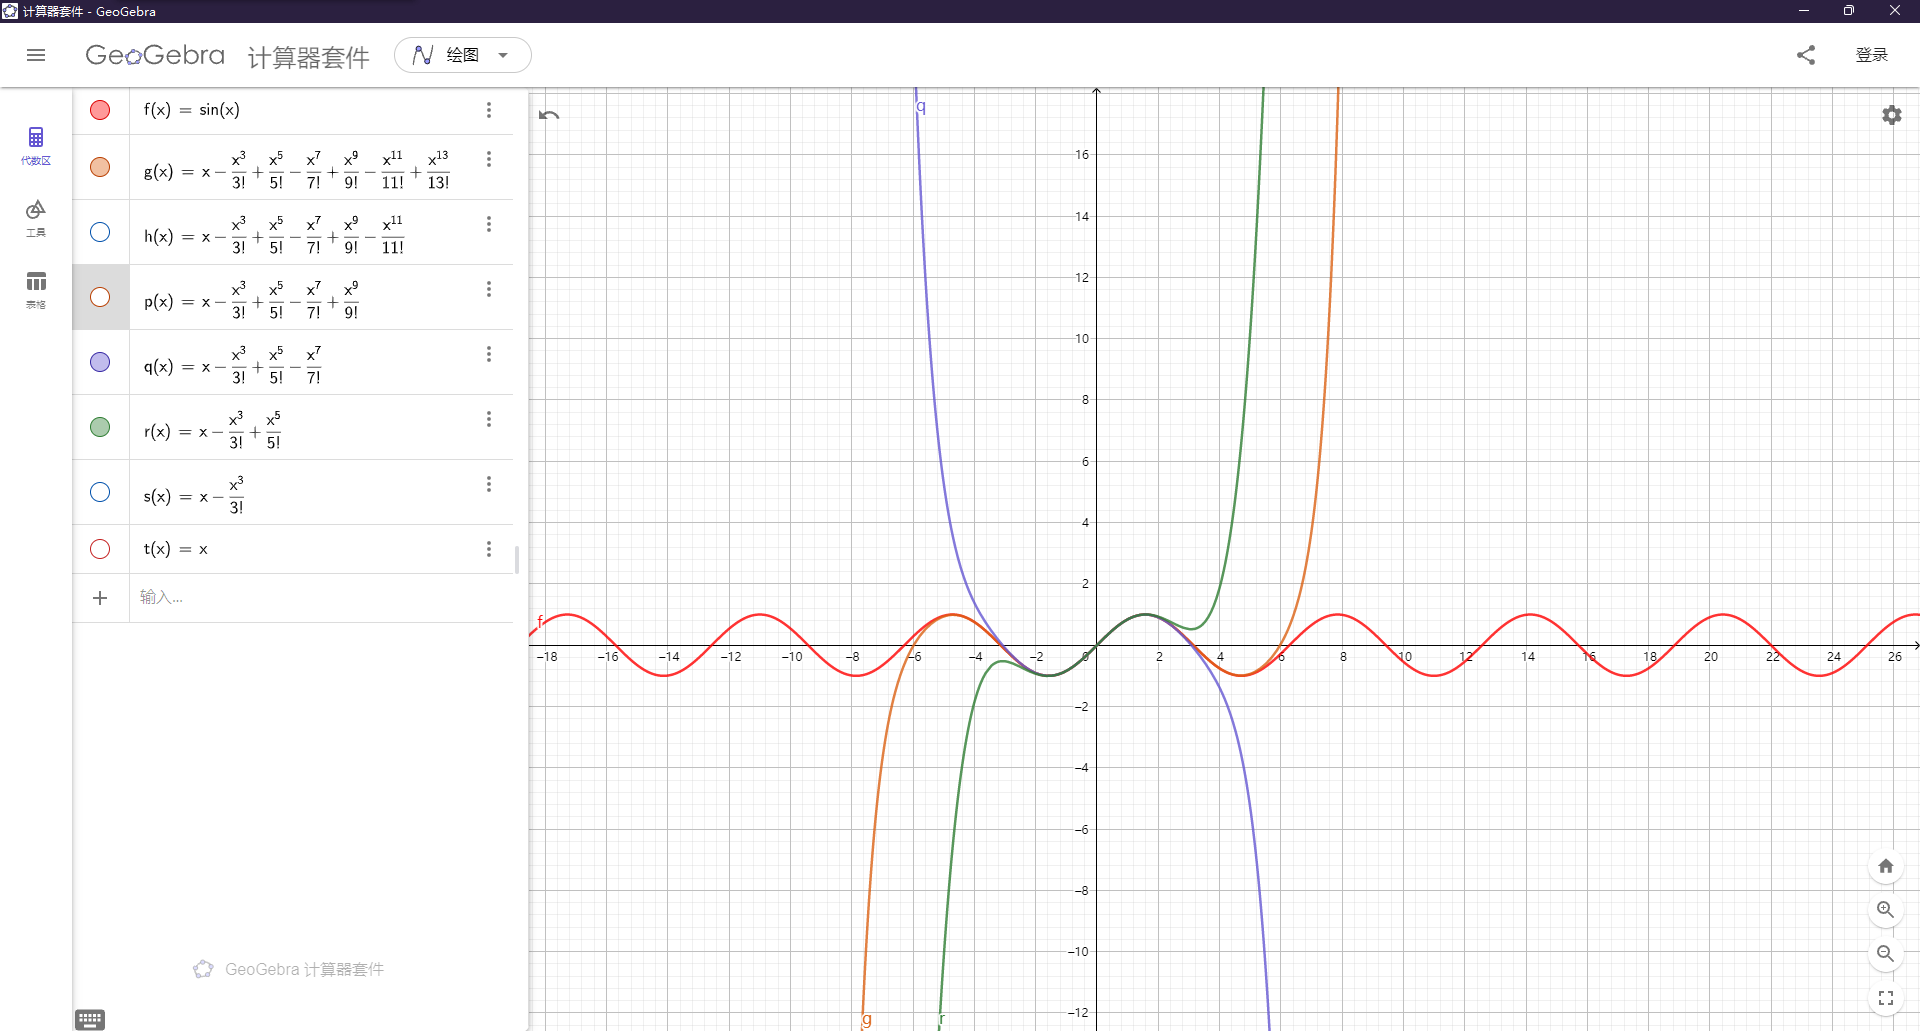
公式 1:sinx的泰勒展开式

image

图 1:sinx在不同项数下的展开

而今天的主角——多项式回归,有些类似于无穷级数。它是利用了多项式来拟合数据集做出预测,算是线性回归的增强版本,拟合曲线方程为 $y = \sum\limits_{i=0}^{m}\sum\limits_{j=0}^{m-i}W_{im+j}X_1^iX_2^j$(这里出于简便只给出了两个特征时的情况)。

2. 简单实现

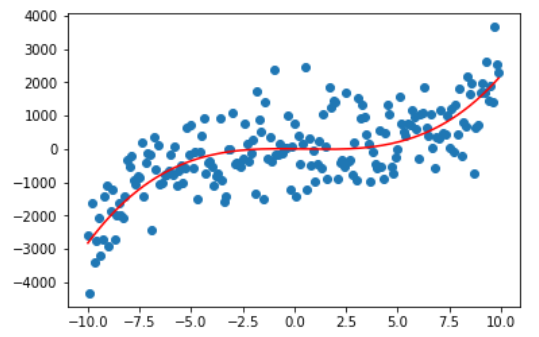
观察下图,这是一个由曲线 $y=2.6x^3-3.14x^2-8.8x$ 生成的数据集,当然是人为地加了些呈正态分布的噪声,红色为实际生成曲线。
image

图 2.1:生成的非线性且带噪声的数据集

1
2
3
4
5
6
7
# 数据生成代码
x = np.arange(-10, 10, 0.1)
y1 = 2.6 * x ** 3 - 3.14 * x ** 2 - 8.8 * x + np.random.normal(0, 800, (200, ))
y2 = 2.6 * x ** 3 - 3.14 * x ** 2 - 8.8 * x
plt.scatter(x, y1)
plt.plot(x, y2, c="red")
plt.show()

对于这样的数据集,已知其最高次为三次,那我们可以直接设拟合曲线方程为 $y = w_1 * x^3 + w_2 * x^2 + w_3 * x + b$,采用梯度下降法来拟合曲线(梯度方向上变化率最大,往负梯度方向移动可以减少 y)。

==注:用预测值减去真实值 $w_1 * x^3 + w_2 * x^2 + w_3 * x + b - y^*$ 得到预测误差,将所有误差绝对值相加就成了损失函数(MAE)。==

1
2
3
4
5
6
7
8
9
10
11
12
13
14
15
16
17
18
19
20
21
22
23
24
25
26
27
28
29
30
# 使用MSE作为损失函数
def f(X_b, y, theta):
return np.mean((X_b @ theta - y) ** 2)

# 损失函数的导数
def df(X_b, y, theta):
return X_b.T @(X_b @ theta - y) * 2 / len(y)

# 梯度下降
def gd(X_b, y, theta, eta = 0.01, n_iters = 1e4, epsilon = 1e-6):
i_iter = 0

while i_iter < n_iters:
# 绘制拟合过程
if i_iter < 10:
display.clear_output(wait=True)
plt.scatter(x, y1)
plt.plot(x, (X_b @ theta).reshape(x.shape), c="green", label = 'predict')
plt.plot(x, y2, c="red", label = 'truth')
plt.show()
plt.pause(0.5)

gradient = df(X_b, y, theta)
last_theta = theta
theta = theta - eta * gradient # -=会连同last_theta一起更改
if abs(f(X_b, y, last_theta) - f(X_b, y, theta)) < epsilon:
break
i_iter += 1

return theta

我们先对原始数据进行预处理,其实本质上还是线性回归,但这里我们将 x 的高次幂也当做额外特征进行运算,从单维特征拓展成了多维特征。

==还有个偏置b,所以多加了一列全1列。==

1
2
3
4
5
6
7
8
9
10
11
12
13
14
15
16
X = x.reshape([-1, 1])
X_b = np.hstack([X ** 3, X ** 2, X ** 1, np.ones_like(X)])
print(X_b[:10])

Output:
# x^3 x^2 x^1 x^0
[[-1000. 100. -10. 1. ]
[ -970.299 98.01 -9.9 1. ]
[ -941.192 96.04 -9.8 1. ]
[ -912.673 94.09 -9.7 1. ]
[ -884.736 92.16 -9.6 1. ]
[ -857.375 90.25 -9.5 1. ]
[ -830.584 88.36 -9.4 1. ]
[ -804.357 86.49 -9.3 1. ]
[ -778.688 84.64 -9.2 1. ]
[ -753.571 82.81 -9.1 1. ]]
1
2
3
4
5
6
7
8
9
initial_theta = np.zeros_like(X_b[1])	# 初始权重方便起见都设为0
theta = gd(X_b, y1, initial_theta, eta = 1e-6, n_iters = 1e5)
print(theta)

Output:
[ 2.46963363 -2.44184783 -4.11097282 7.58382791]

Expected:
[2.6 -3.14 -8.8 0]

123

图 2.2:非线性曲线拟合过程

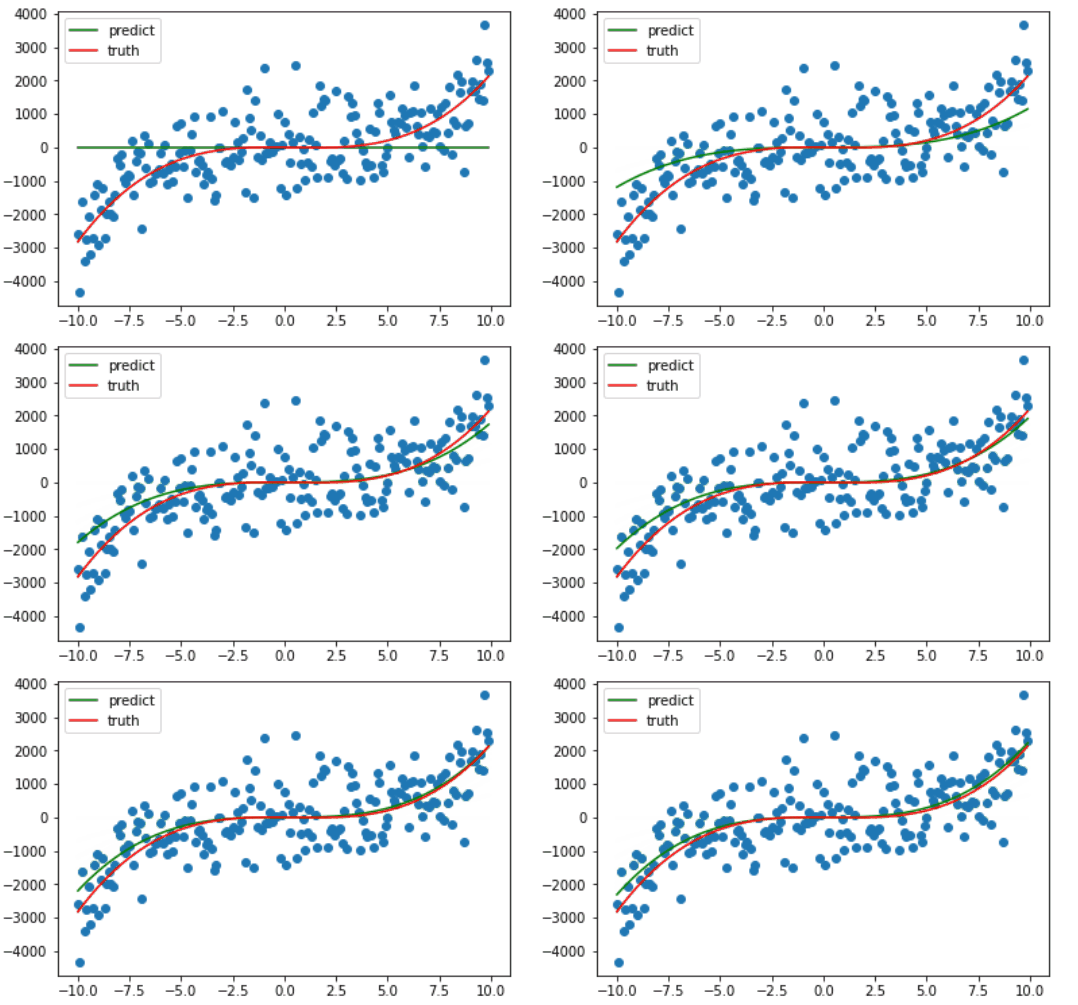
因为绘图比较费时,我只绘制了前十次梯度下降的过程,可以看出仅仅十次更新,训练的曲线已经和真正的曲线相差无几了。

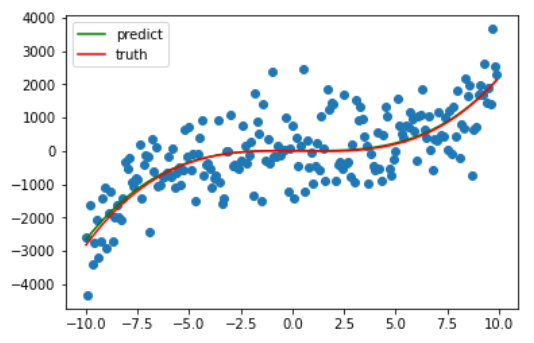
最后在训练了 1e5 次后,系数最终被更新成 **[ 2.46963363 -2.44184783 -4.11097282 7.58382791]**,与原先设定的 [2.6 -3.14 -8.8 0] 差距不大,最后拟合完毕的曲线如下。
image

图 2.3:最终拟合结果

3. 多项式特征

在上述实现中,我们事先知道了这是个一元三次函数,因此将待拟合方程设成了一元三次方程的标准方程。但在正常情况下,我们不可能知道手头的数据集应该是一个几次的方程。所以这也就成为了我们在训练模型前需要额外设置的一个超参数。

而当存在多个初始特征时,多项式回归还能帮助我们寻找到特征之间的关联(这也是较线性回归增强的部分)。例如有两个特征 ab,当次数为 3 时,多项式特征不仅把它们扩展成 $a^3$, $a^2$,$a$, $b^3$, $b^2$,$b$,还会添加这两个特征的组合,$a^2b$, $ab^2$ 和 $ab$。在初始特征 ab 与 **y ** 看似没太大关系时,这些新增的特征反而更能体现与 y 的关系。

1
2
3
4
5
6
7
8
9
10
11
12
13
# 生成多项式特征
def generatePolynomialFeatures(X, degree):
def dfs(X, result, start, col_val, degree):
result.append(col_val)
if(degree == 0):
return

for i in range(start, X.shape[1]):
dfs(X, result, i, col_val * X[:, i].reshape([-1, 1]), degree - 1)

result = []
dfs(X, result, 0, np.ones([len(X), 1]), degree)
return np.squeeze(np.array(result), -1).T

测试

1
2
3
4
5
6
7
8
9
10
11
12
13
14
15
16
17
18
19
20
X = np.arange(1,19, 1).reshape([-1, 3])
X_b = generatePolynomialFeatures(X, 2)
print(X)
print(X_b)

# a b c
[[ 1 2 3]
[ 4 5 6]
[ 7 8 9]
[10 11 12]
[13 14 15]
[16 17 18]]

# a b c a^2 ab ac b^2 bc c^2 1
[[ 1. 2. 3. 1. 2. 3. 4. 6. 9. 1.]
[ 4. 5. 6. 16. 20. 24. 25. 30. 36. 1.]
[ 7. 8. 9. 49. 56. 63. 64. 72. 81. 1.]
[ 10. 11. 12. 100. 110. 120. 121. 132. 144. 1.]
[ 13. 14. 15. 169. 182. 195. 196. 210. 225. 1.]
[ 16. 17. 18. 256. 272. 288. 289. 306. 324. 1.]]

==注:n元m次会扩展到 $\frac{(n+d)!}{n!d!}$,这可比指数爆炸恐怖多了,组合爆炸!(还会产生其它问题,后面我们再讲)因此需要谨慎选择 degree 这个超参数。==

4. 封装成类

最后将上述代码封装成一个多项式回归的类。

1
2
3
4
5
6
7
8
9
10
11
12
13
14
15
16
17
18
19
20
21
22
23
24
25
26
27
28
29
30
31
32
33
34
35
36
37
38
39
40
41
42
43
44
45
46
47
48
49
50
51
52
53
54
55
56
57
58
59
60
61
62
63
64
65
66
67
68
69
70
71
72
73
74
75
76
77
78
79
80
81
82
83
84
85
class PolynomialRegession:

# 生成多项式特征
def generatePolynomialFeatures(self, X):
def dfs(X, result, start, col_val, d):
result.append(col_val)
if(d == 0):
return

for i in range(start, X.shape[1]):
dfs(X, result, i, col_val * X[:, i].reshape([-1, 1]), d - 1)

result = []
dfs(X, result, 0, np.ones([len(X), 1]), self.degree)
return np.squeeze(np.array(result), -1).T

# 均值方差归一化 -> avg = 0, std = 1
def standardization(self, X):
tmp = X[:,1:]
self.mean = np.mean(tmp, axis=0)
self.std = np.std(tmp, axis = 0)
return np.hstack([np.ones([len(X), 1]), (tmp - self.mean) / self.std])

# 使用MSE作为损失函数
def f(self, X_b, y, theta):
return np.mean((X_b @ theta - y) ** 2)

# 损失函数的导数
def df(self, X_b, y, theta):
return X_b.T @(X_b @ theta - y) * 2 / len(y)

# 梯度下降
def gd(self, X_b, y, theta, eta, n_iters, epsilon, plot_process):
i_iter = 0

while i_iter < n_iters:
if (plot_process and (i_iter + 1) % 1000 == 0) and (i_iter + 1) <= 10000 or (i_iter + 1) == n_iters:
self.paint(X_b, theta)

gradient = self.df(X_b, y, theta)
last_theta = theta
theta = theta - eta * gradient
if abs(self.f(X_b, y, last_theta) - self.f(X_b, y, theta)) < epsilon:
self.paint(X_b, theta)
break
i_iter += 1

return theta

# 拟合
def fit(self, X, y, degree, eta = 1e-2, n_iters = 1e5, epsilon = 1e-6, plot_process = True, standard = True):
self.standard = standard
self.degree = degree
self.X_b = self.generatePolynomialFeatures(X)

if standard:
self.X_b = self.standardization(self.X_b)
# initial_theta = np.random.normal(size=(self.X_b[1].shape))
initial_theta = np.zeros_like(self.X_b[1])
self.theta = self.gd(self.X_b, y, initial_theta, eta=eta, n_iters=n_iters, epsilon=epsilon, plot_process=plot_process)
self.coefficient = self.theta[1:]
self.intercept = self.theta[0]

# 预测,归一化用的是训练时的平均值和标准差!
def predict(self, X):
pfX = self.generatePolynomialFeatures(X)
if self.standard:
pfX = np.hstack([(pfX[:, :-1] - self.mean) / self.std, np.ones([len(X), 1])])
return pfX @ self.theta

# 预测分析
def score(self, X, y):
return np.mean((predict(X) - y) ** 2)

def paint(self, X_b, theta):
display.clear_output(wait=True)
plt.scatter(x, y1)
plt.plot(x, (X_b @ theta).reshape(x.shape), c="green", label = 'predict')
plt.plot(x, y2, c="red", label = 'truth')
plt.legend()
plt.title("degree = " + str(self.degree))
plt.xlim(np.min(x) - 0.3, np.max(x) + 0.3)
plt.ylim(np.min(y1) - 5, np.max(y1) + 5)
plt.show()
plt.pause(0.5)

在上述实现中,新增了一个名为 standardization(均值方差归一化)的方法,这是因为多项式化采用了特征组合的方式,在 degree 很大时,例如 100,那么新增特征中的最高次就会是 100 次,这是一个十分恐怖的数,而最低次只是常数级,各个特征维度之间的跨度非常大!这就导致 eta 必须非常小,但凡稍大一点,高次项系数更新就会溢出,而过小的 eta 会导致低次项的系数根本更新不动(需要数以千万计次的更新)!

由此我们便加入了 standardization,在多项式化之后将各个特征放缩到均值为 0,方差为 1 的范围上来,把有量纲的表达式改成无量纲的表达式,将数据的所有特征都映射到一个统一的尺度下。

而且归一化后可以加速训练,**图 4.1 **左侧因为进行了归一化,因此等高线几乎是正圆,等高线上的法线指向圆心,因此能快速收敛到最小值,而右图没有进行归一化则需进行多次迭代。

==注:由于进行了归一化,我们的模型都是按照归一化的数据进行训练的,因此测试数据也要进行归一化,否则没有意义了。==
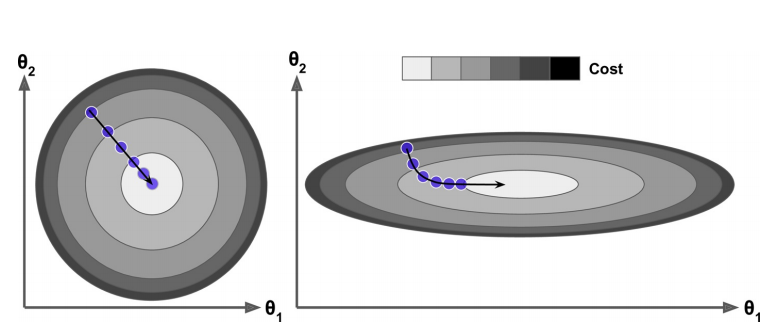
图 4.1:归一化与未归一化(图源来自机器学习实战)

okay,下面让我们来测试一下这个多项式回归类!

1
2
3
4
5
6
7
x = np.arange(-5, 5, 0.1)
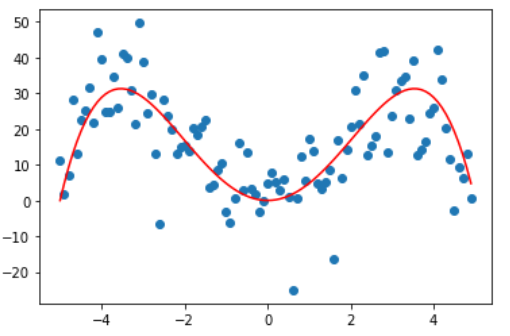
# 这次换一个四次函数
y1 = -0.2 * x ** 4 + 5 * x ** 2 + np.random.normal(0, 10, (100, ))
y2 = -0.2 * x ** 4 + 5 * x ** 2
plt.scatter(x, y1)
plt.plot(x, y2, c="red")
plt.show()

image

图 4.2:四次函数数据样本

1
2
3
pr = PolynomialRegession()
X = x.reshape(-1, 1)
pr.fit(X, y1, 4, 1e-5)

222

图 4.3:四次函数拟合过程

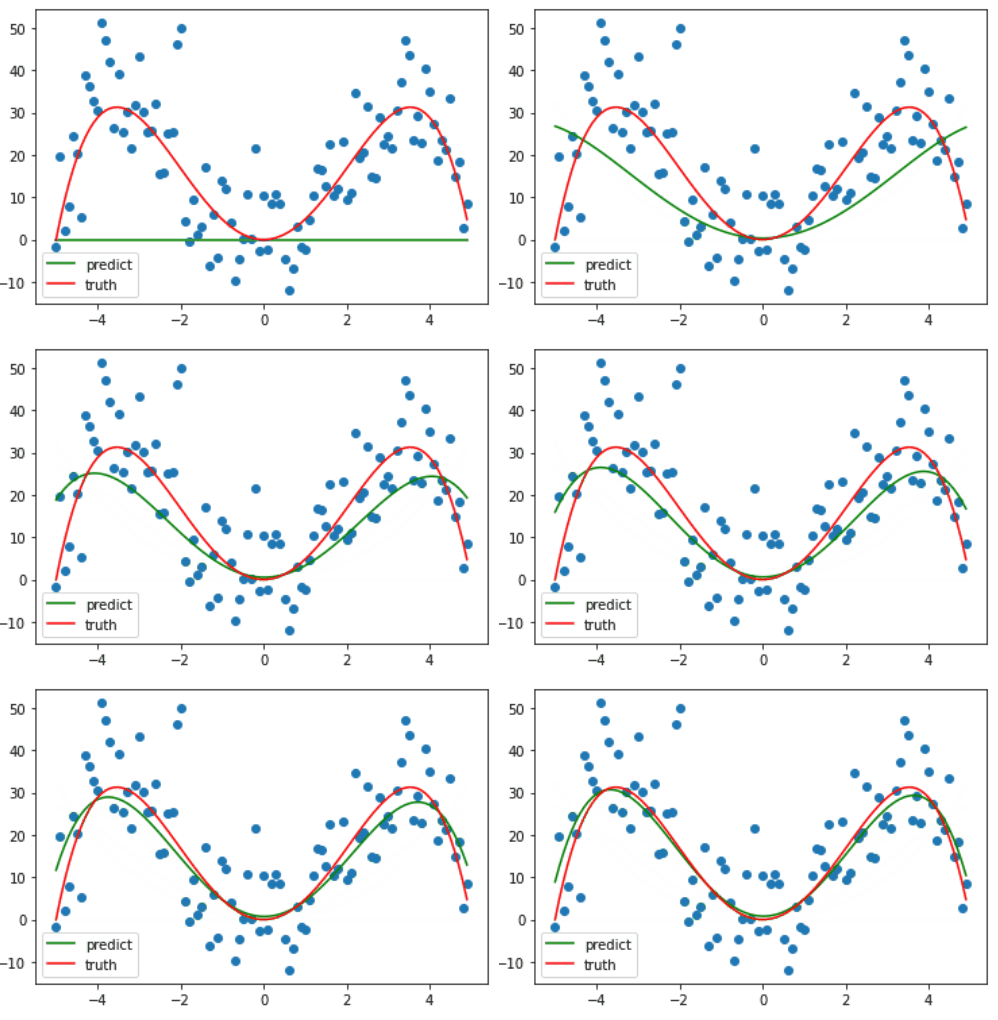
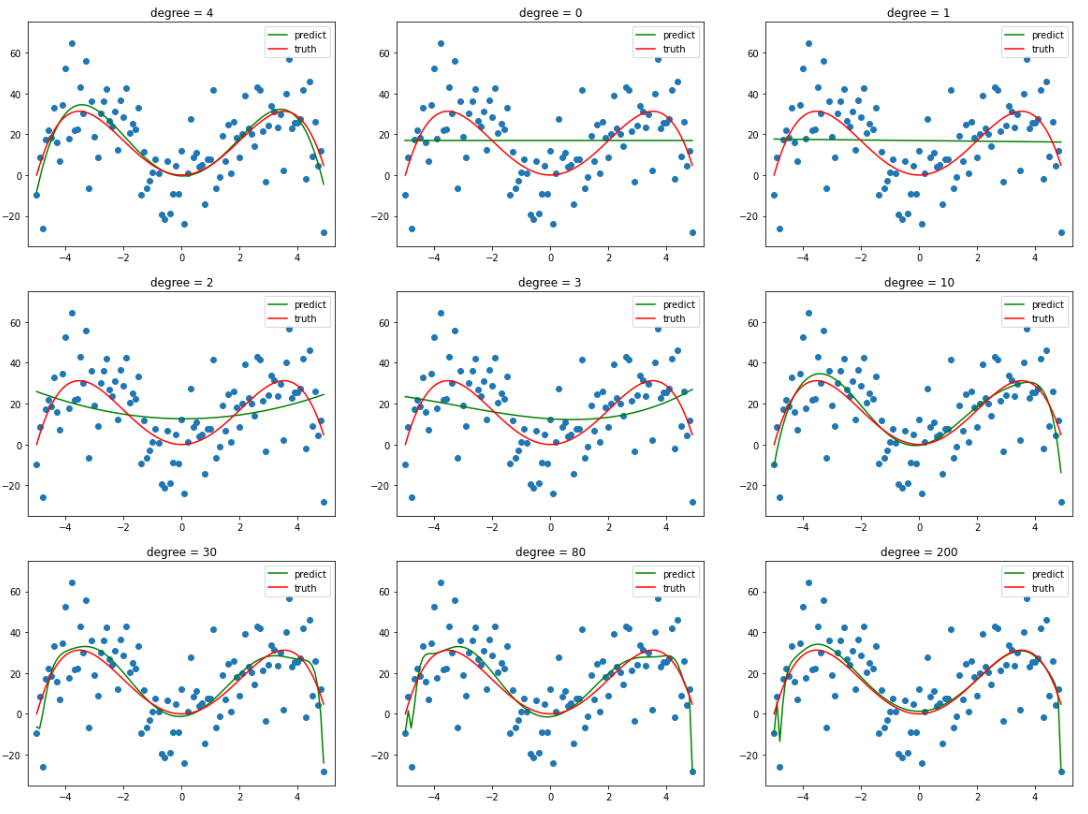
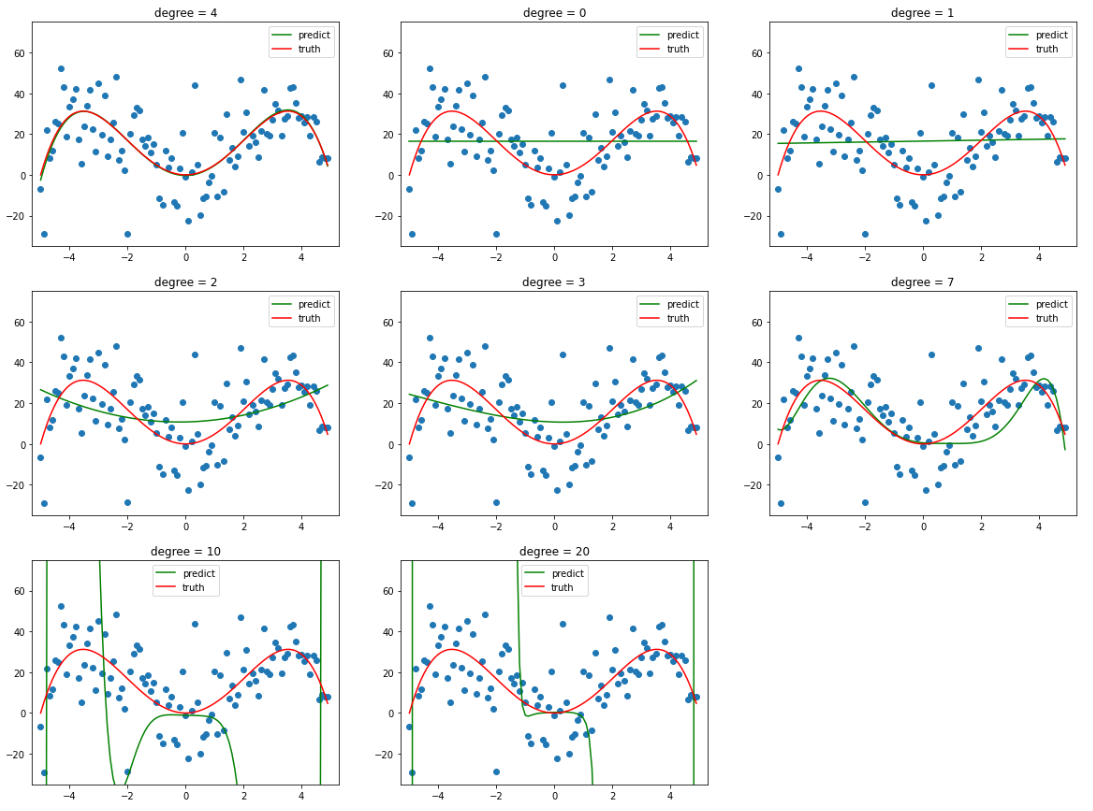
诶,那这个时候又有人要问了啊,诶虽然现在是拟合了数据集,但这不还是事先知道了这是个四个方程才设的多项式方程吗?嗯没错,接下来就看一下,如果 degree 取其它值会发生什么情况?
image

图 4.4:degree的不同取值(未加归一化)

image

图 4.5:degree的不同取值(加归一化)

degree 较小时,其拟合曲线也较为简单,并不能很好地反映样本的趋势,也就是==欠拟合==。

而当 degree 逐渐增加时,其拟合的曲线便会更加 复杂,有更多的 “==弯==”,也就意味着当 degree 足够大时,其完全可以将整个样本给 “记住”,以达到在训练集上几乎百分百的预测率,这就是 ==过拟合==。但这根本不是我们所需要的!我们希望训练出来的模型不仅能在训练集上表现良好(当然喽),还要能对未来中那些没有见过的数据给出正确的预测,不然就是在自欺欺人罢了!

**图 4.4 ** 后面两张就是因为 eta 过小,训练不充分还没有完全拟合,看不出来过拟合的效果(PS:已经迭代 100W 次了,在往上耗时太长了)。

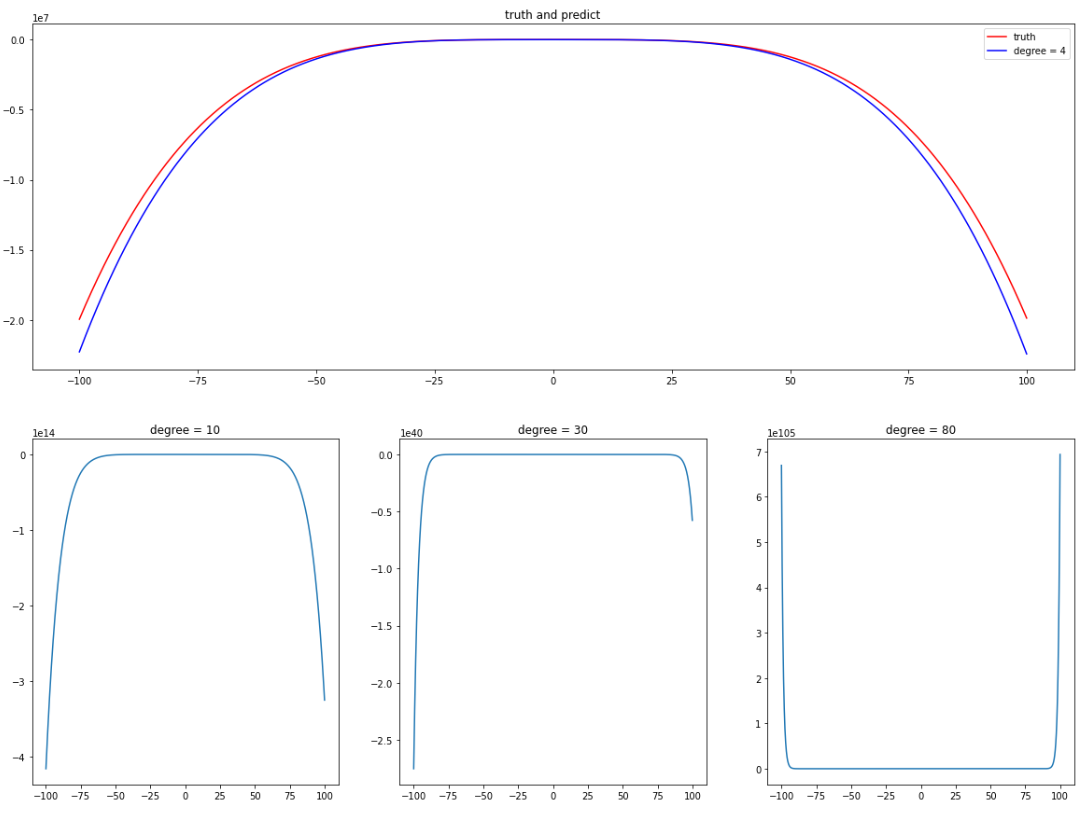
那么当给出训练集样本之外的数据时(这里训练集之外的样本指 [-100, 100] 的曲线),这些在训练集上表现 “貌似还不错” 的模型的表现又会怎么样呢?
image

图 4.6:部分模型的预测情况

图 4.6,只有 degree = 4 时和原曲线还算是接近,其余的一个比一个离谱,degree 越大,误差越大。

至于如何减少过拟合呢,通俗来讲就是对模型进行==约束==。模型所拥有的 自由度 越少,那么其就越不会过拟合。

通常我们可以减少方程的 “容量”,交叉验证,dropout (不过在只有一层的传统机器学习中就相当于减少方程容量了)等,又或者是下面要介绍的正则化。

5. 正则化

正则化,一言以蔽之就是 限制 模型的 ==权重==,一般有 岭回归(L2),Lasso 回归(L1)和 **弹性网络 **等。

那么该怎么限制权重呢?很简单,把权重也一起加入到损失函数中就行了,这会迫使梯度下降在更新的时候不仅需要考虑如何让模型尽量拟合测试数据,还要考虑如何让权重尽可能地小。

5.1 岭回归

公式 5.1.1:岭回归损失函数
$$
\begin{equation*}
\begin{split}
Ridge(\theta)
& = loss(\theta) + \frac{\alpha}{2}\sum\limits_{i=1}^{n}\theta^2_i\
& = \frac{1}{m}(X\theta-y)^T(X\theta-y) + \frac{\alpha}{2}\theta^T\theta
\end{split}
\end{equation*}
$$
公式 5.1.2:岭回归导函数
$$
\begin{equation*}
\begin{split}
\frac{dRidge(\theta)}{d\theta}
& = \frac{dloss(\theta)}{d\theta} + \alpha\theta\
& = \frac{2}{m}X^T(X\theta-y) + \alpha\theta
\end{split}
\end{equation*}
$$
公式5.1中,不仅将权重加入到了损失函数中,还设置了一个超参数 α 用以调节正则化权重的==占比==。

α = 0 时,其就变为了普通的多项式回归,岭回归不会再起作用。α 越大,各特征的权重值就越小,体现在图像上则为曲线越光滑越平坦。当 **α -> $+\infty$**,为了使损失函数尽可能地小,梯度下降只能将权重尽可能地都更新为 0,也就变成了常值函数($y = \overline{y}$)。

因此 alpha 的取值还是比较考究的。

==注1:公式中 i 从 1 开始,即不包含偏置项,因为偏置项只用来调整曲线位置,并不会扭曲其图像。==

==注2:使用岭回归之前,一定一定要归一化数据!!!(血的教训)大多数正则化模型都对输入特征的缩放十分敏感!!!==

下面给出岭回归的部分代码实现,这里只给出了较多项式回归增加的部分,其余基本一致。

1
2
3
4
5
6
7
8
9
10
11
12
13
class RidgeOfPolynomialRegession:

# Ridge
def f(self, X_b, y, theta):
return (X_b @ theta - y) @ (X_b @ theta - y) / len(y) + theta[1:] @ theta[1:] * self.alpha / 2

# dRidge
def df(self, X_b, y, theta):
return X_b.T @(X_b @ theta - y) * 2 / len(y) + np.hstack([self.alpha * theta[1:], np.zeros(0)])

# 正规方程解
def math(self, X_b, y):
return np.linalg.inv(X_b.T @ X_b + self.alpha * np.eye(X_b.shape[1])) @ X_b.T @ y

为了保证严谨,还是用的之前的样本,对比一下用了岭回归和没用岭回归的差别。

image

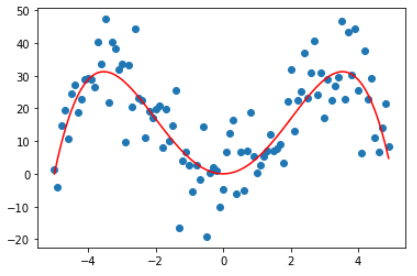
图 5.1.1:四次函数样本图像
1
2
3
4
5
6
7
x = np.arange(-1, 1, 0.15)
X = x.reshape(-1, 1)
y1 = x ** 2 - 3 * x + np.random.normal(0, 0.3, size = x.shape)
y2 = x ** 2 - 3 * x
plt.scatter(x, y1)
plt.plot(x, y2, c="red")
plt.show()

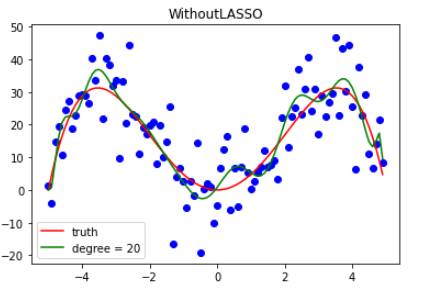
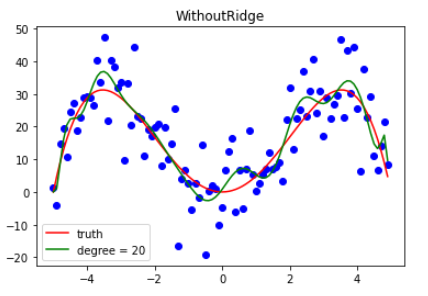
图 5.2 所示,由于曲线次数比较高,导致表达能力过强了,会有一种曲线就是在把样本连起来的感觉,学习拟合变成了连线游戏。
image

图 5.1.2:没有岭回归
1
2
3
4
5
plt.plot(x, y2, c = 'red', label = "truth")
plt.scatter(x, y1, c = 'blue')
plt.plot(x, y_test_1, c = "green", label = "degree = 20")
plt.legend()
plt.title("WithoutRidge")

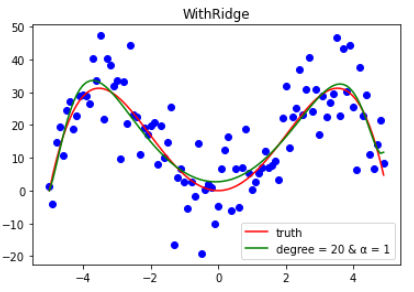
而在加上岭回归之后,明显曲线就变光滑很多了,不是纯粹地只记住了样本,与原函数相比还是挺接近的,可以进行一定程度的预测。
image

图 5.1.3:岭回归 α = 1
1
2
3
4
5
plt.plot(x, y2, c = 'red', label = "truth")
plt.scatter(x, y1, c = 'blue')
plt.plot(x, y_test_2, c = "green", label = "degree = 20 & α = 1")
plt.legend()
plt.title("WithRidge")

5.2 LASSO 回归

讲完岭回归之后,LASSO 回归就很简单了,全名 Least Absolute Shrinkage and Selection Operator Regression,中文名最小绝对收缩和选择算子回归。

与岭回归类似,只是新增项变成了 L1 范式 —— $\alpha\sum\limits_{i=1}^{n}|\theta_i|$。

公式 5.2.1:LASSO 回归损失函数
$$
\begin{equation*}
\begin{split}
LASSO(\theta)
& = f(\theta) + \alpha\sum\limits_{i=1}^{n}|\theta_i| \
& = \frac{1}{m}(X\theta-y)^T(X\theta-y) + \alpha\sum\limits_{i=1}^{n}|\theta_i|
\end{split}
\end{equation*}
$$
公式 5.2.2:LASSO 回归导函数
$$
\begin{equation*}
\begin{split}
\frac{dLASSO(\theta)}{d\theta}
& = \frac{dloss(\theta)}{d\theta} + \alpha sign(\theta)\
& = \frac{2}{m}X^T(X\theta-y) + \alpha sign(\theta)
\end{split}
\end{equation*}
$$
绝对值函数==在零点处不可导==同时也是极小值,因此要手动让其等于 0。而函数值大于 0 时导数为 1,小于 0 时为 -1,这不就是符号函数(sign)了嘛。

LASSO 的新增代码。

1
2
3
4
5
6
7
8
class LASSOOfPolynomialRegession:
# LASSO
def f(self, X_b, y, theta):
return (X_b @ theta - y) @ (X_b @ theta - y) / len(y) + np.sum(np.abs(theta[1:])) * self.alpha

# dLASSO
def df(self, X_b, y, theta):
return X_b.T @(X_b @ theta - y) * 2 / len(y) + self.alpha * np.hstack([np.zeros(1), np.sign(theta[1:])])

同岭回归类似,下面只给出拟合结果。

image

图 5.2.1:没有LASSO回归

image

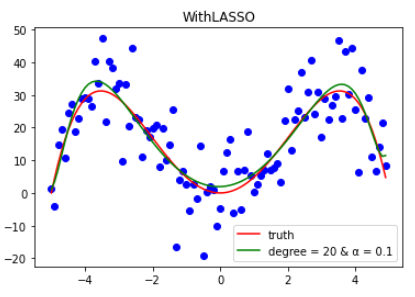
图 5.2.2:LASSO回归 α = 0.1

5.3 对比

既然岭回归和 LASSO 回归都是通过正则化来降低过拟合,那么它们两个有什么区别呢?

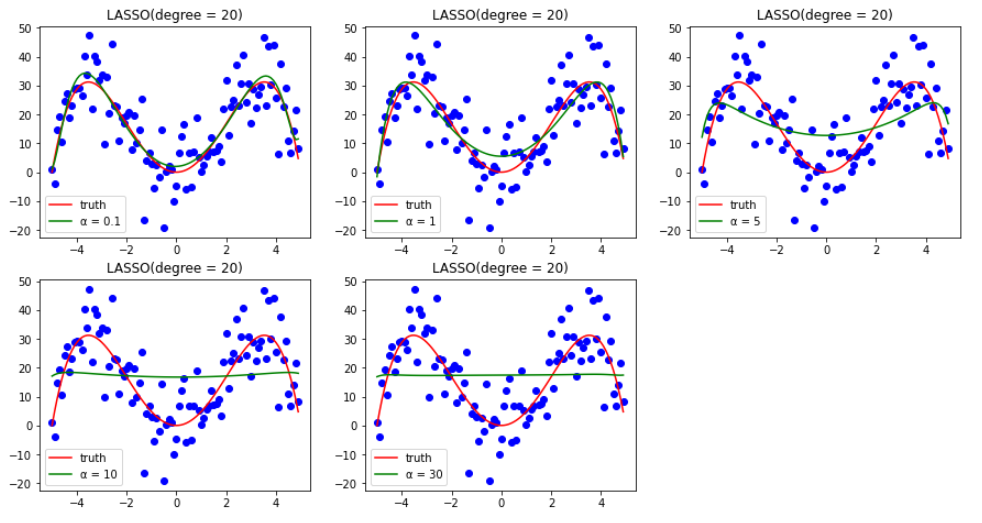
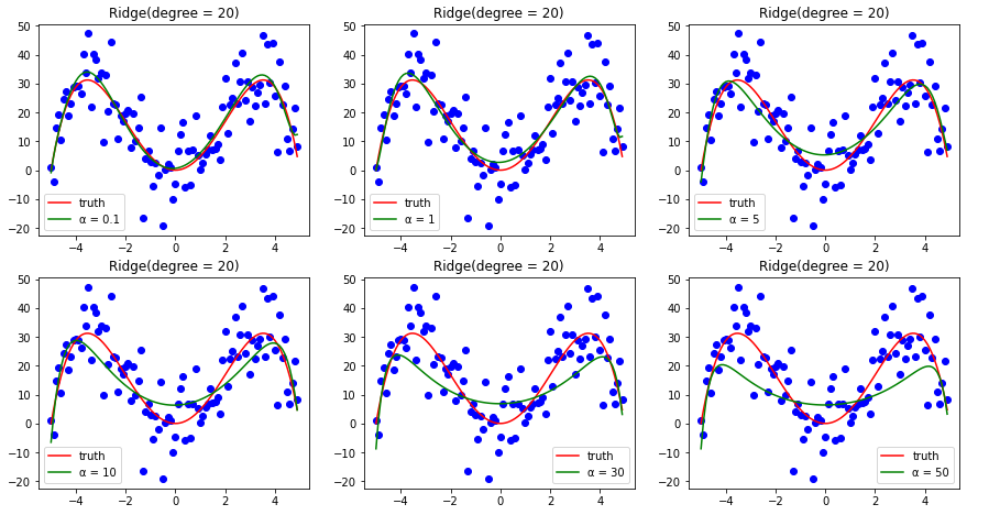
答:区别是肯定有的,请看下面两张图。(α 为[0.1, 1, 5, 10, 20])
image

图 5.3.1:岭回归下不同α的图像

image

图 5.3.2:LASSO 回归下不同α的图像

通过上两张图可以发现,在 α 逐渐增大时,二者的表现还是有所不同的。岭回归会越来越==平坦==(但始终还是曲线),而 LASSO 回归则会越来越==直==。

首先,α 越大,损失函数中关于参数权重正则化的那部分比重也就越大,由此我们可以忽略前面的 MSE

岭回归的导函数也就可以近似为 αθ,同理 LASSO 回归也可以近似为 **sign(θ)**。

sign(θ) 只有三个值:-1, 1, 0。因此只能按照非常规则的方式更新,而在这个过程中就会有一些权重值提前来到零点,反映在图像上就会越来越接近直线。这也是它名字的由来——==选择算子回归==,将没用的特征权重设为零(当然也可能是有用的),留下另一些特征。
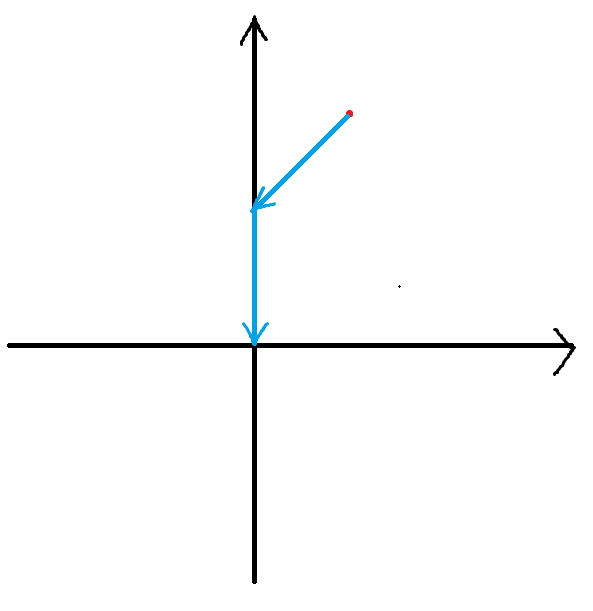
image

图 5.3.3:LASSO 梯度下降

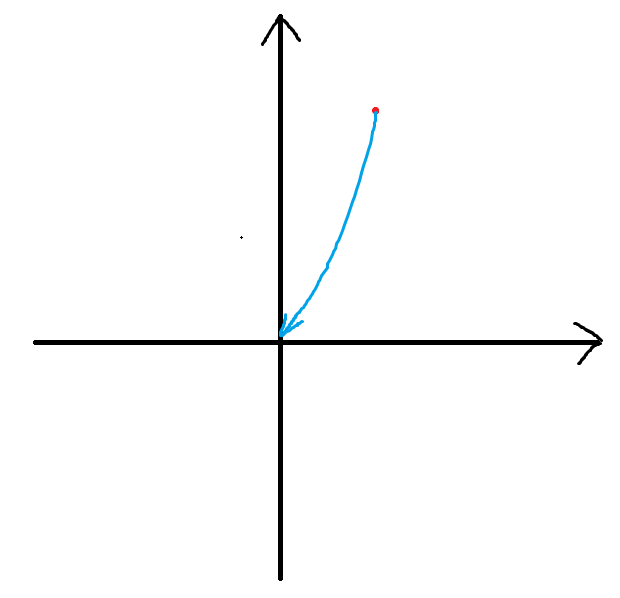
αθ 则会根据每个特征赋予不同权重更新,如 **图 5.3.4 **更新轨迹呈一个曲线型,权重一般不会更新成 0,反映在图像上也就会越来越平坦,像==山岭==一样。
image

图 5.3.4:岭回归 梯度下降

5.4 弹性网络

弹性网络 将上述两个正则化结合在了一起,算是进行了折中。

公式 5.4.1:弹性网络损失函数
$$
\begin{equation*}
\begin{split}
LASSO(\theta)
& = f(\theta) + r\alpha\sum\limits_{i=1}^{n}|\theta_i| + \frac{1-r}{2}\alpha\sum\limits^n_{i=1}\theta_i^2\
& = \frac{1}{m}(X\theta-y)^T(X\theta-y) + r\alpha\sum\limits_{i=1}^{n}|\theta_i| + \frac{1-r}{2}\alpha\sum\limits^n_{i=1}\theta_i^2
\end{split}
\end{equation*}
$$
弹性网络 新增了一个超参数 r,而 α 的含义仍旧没变。我们可以通过调节 r 来控制 LASSORidge 的==混合比==。

r = 1 时,该弹性网络等效于 LASSO 回归;当 r = 0 时,该弹性网络等效于 岭回归