0%

1、网格搜索

1.1、什么是网格搜索?

过拟合和欠拟合 中,我们是手动调整超参数 degree ,经由人工一一比对来获取最好的值,效率比较低下。因此我们引入网格搜索这个概念,不要被这个看起来很高大上的名词吓唬住了,其实逻辑十分简单,具体请看下述代码。

使用 sklearn 中自带的波士顿房产数据作为我们的测试数据。

1
2
3
4
5
6
7
8
9
10
import sklearn
from sklearn.model_selection import train_test_split
from sklearn import datasets
from sklearn.neighbors import KNeighborsRegressor

boston = datasets.load_boston()
X = boston.data
y = boston.target

X_train, X_test, y_train, y_test = train_test_split(X, y)

这里我们要网格搜索的参数即为 p,neighbor, weight。

可以看到所谓 网格搜索 就是使用 for-loop 像网格一样将你预设的可能的值都遍历一遍,依次寻求 score 最高的超参数组合。

1
2
3
4
5
6
7
8
KNN中的超参数:
- weights:含有 `uniform``distance` 两种模式
uniform 是正常的模式
distance 给 k 个相邻的点按照距离远近都赋予一个权重,离预测样本点距离远的权重就低一些,距离近的权重就高一些,

- p:闵可夫斯基距离参数
p = 1 时,等价于曼哈顿距离
p = 2 时,等价于欧拉距离
1
2
3
4
5
6
7
8
9
10
11
12
13
14
15
16
17
18
19
20
21
22
23
24
25
weights = ["uniform", "distance"]
best_score = -1
best_p = 0
best_neighbor = 0
best_weight = ""

for weight in weights:
for neighbor in range(1, 10):
for p in range(1, 10):
reg = KNeighborsRegressor(n_neighbors=neighbor,
weights = weight,
p = p,
n_jobs = -1)
reg.fit(X_train, y_train)
score = reg.score(X_test, y_test)
if score > best_score:
best_score = score
best_neighbor = neighbor
best_p = p
best_weight = weight

print("best_weight =", best_weight)
print("best_p =", best_p)
print("best_neighbor =", best_neighbor)
print("best_score =", best_score)

输出结果如下。

1
2
3
4
best_weight = distance
best_p = 1
best_neighbor = 3
best_score = 0.7420720968121362

注:KNeighborsRegressor 和 KNeighborsClassifier 思想相同。

KNeighborsClassifier 是找到附近 k 个数据,找到最多那个类别作为预测的类别,用于解决分类问题。

而 KNeighborsRegressor 是找到附近 k 个数据,然后取平均值作为预测的数值,用于解决回归问题。


1.2、scikit 中的实现

1
2
3
4
5
6
7
8
9
10
11
from sklearn.model_selection import GridSearchCV

params = {
"weights" : ["uniform", "distance"],
"p" : [i for i in range(1, 10)],
"n_neighbors" : [i for i in range(1, 10)]
}

knn_reg = KNeighborsRegressor()
grid_search=GridSearchCV(knn_reg, params)
%time grid_search.fit(X_train,y_train)

GridSearchCV 使用交叉验证来训练数据,即 train-validation-test。因此best_score_可能会比较低。

1
2
3
grid_search.best_params_ = {'n_neighbors': 5, 'p': 1, 'weights': 'distance'}
grid_search.best_score_ = 0.6091159004372775
grid_search.best_estimator_.score(X_test, y_test) = 0.7276418519232821

2、交叉验证

在之前模型的训练中,我们都是以测试数据集的 score 来衡量模型的好坏,换言之就是根据 test_score 来调整超参数,并从所有的模型中挑出 test_score 最高的作为我们的预测模型。但这样也会暴露出一个问题,在模型训练期间,我们的模型就已经见过了测试数据集,因此可能会过拟合测试数据集!

这样肯定是不对的,要模拟真正的生产环境,那么测试数据集就不能参与到模型的训练当中。我们只需要再引入一个验证数据集来代替之前测试数据集的作用就行了。
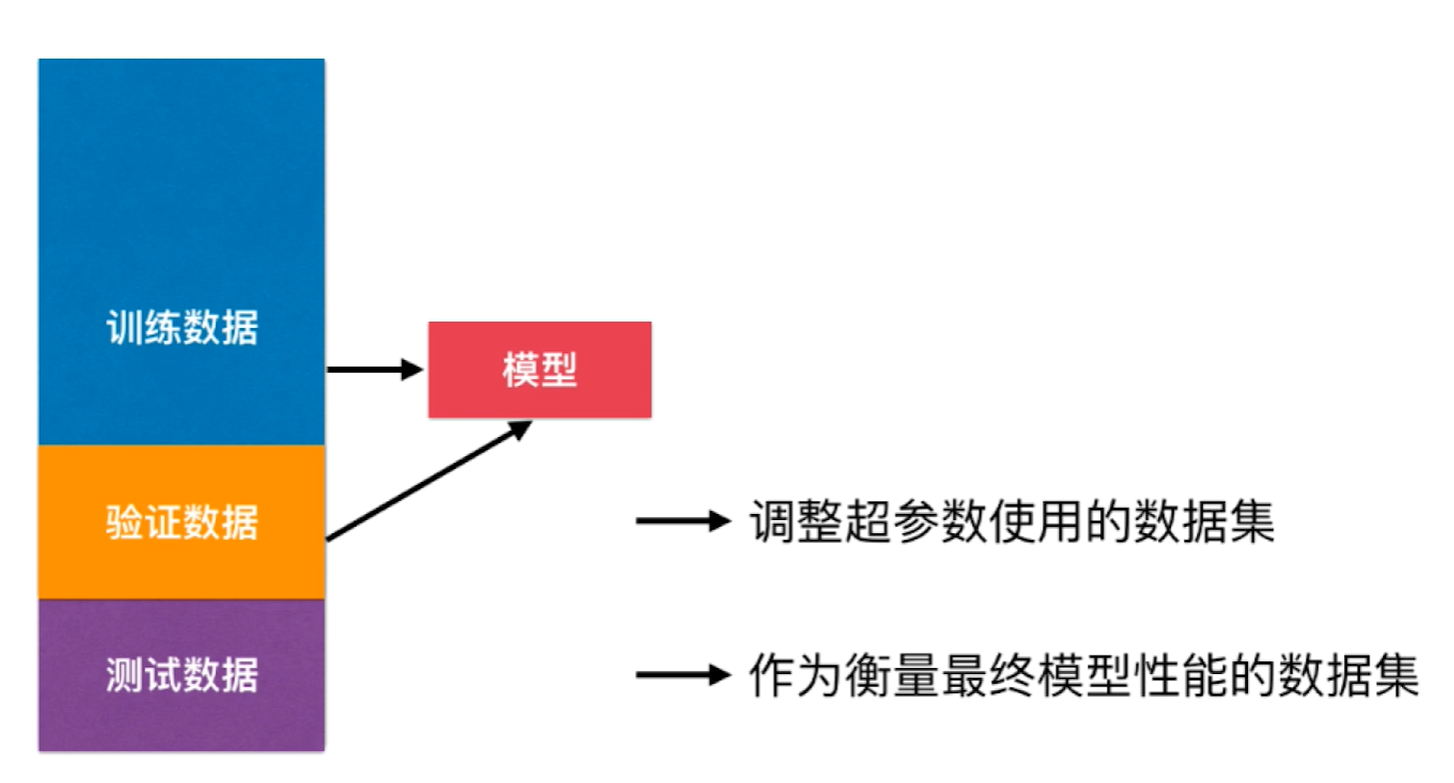
但其实这样也会有过拟合验证数据集的问题,因此就有了交叉验证。具体则是将训练数据集分成 K 份,从这 K 份当中选择一份作为验证数据集,其余 K-1 份作为训练数据集。一共有 $C^1_K = K$ 种分法,因此我们可以得到 K 个模型,因此这也被称为 K-folds Cross Validation(K折交叉验证),最后取他们在验证数据集上的均值作为判断模型好坏的依据。

这里提一句,在 scikit-learn 的网格搜索中,默认使用的是 cv = 5 的交叉验证,也就是五折交叉验证。

当交叉验证的 K = n_samples 时,会产生 n_samples 个模型,这时训练出来的模型完全不受随机的影响,将最接近模型真正的性能指标,代价就是训练时间会扩大 n_samples 倍,这就是 LOO-CV(Leave One Out Cross Validtion),也就是留一法。

2.2、代码实现

1
2
3
4
5
6
7
8
9
10
11
12
13
14
15
16
17
18
19
20
21
22
23
24
25
26
27
28
29
30
31
32
# 将第i份作为验证集
def get_k_fold_data(k, i, X, y):
assert k > 1
fold_size = X.shape[0] // k
X_train, y_train = None, None
for j in range(k):
idx = slice(j * fold_size, (j+1) * fold_size)
X_part, y_part = X[idx, :], y[idx]
# 第i份即为验证集
if j == i:
X_valid, y_valid = X_part, y_part
# 除第i份以外的第一份作为train的开头
elif X_train is None:
X_train, y_train = X_part, y_part
# 其余拼接到后面
else:
X_train = tf.concat([X_train, X_part], 0)
y_train = tf.concat([y_train, y_part], 0)
return X_train, y_train, X_valid, y_valid

# 交叉验证
def k_fold(k, X_train, y_train, num_epochs, learning_rate, weight_decay, batch_size):
train_loss_sum, valid_loss_sum = 0, 0
for i in range(k):
data = get_k_fold_data(k, i, X_train, y_train)
net = get_net()
train_loss, valid_loss = train(net, *data, num_epochs, learning_rate, weight_decay, batch_size)
train_loss_sum += train_loss[-1]
valid_loss_sum += valid_loss[-1]
print(f'fold {i + 1}, train log rmse {float(train_loss[-1]):f}, '
f'valid log rmse {float(valid_loss[-1]):f}')
return train_loss_sum / k, valid_loss_sum / k

1、 Spring

1.1、 简介

  • Spring:春天 ——> 给软件行业带来了春天!

  • 2002年,首次推出了 Spring 框架的雏形:interface21 框架!

  • Spring 框架即以 interface21 框架为基础,经过重新设计,并不断丰富其内涵,于2004年3月24日,发布了1.0正式版。

  • Rod Johnson,Spring Framework 创始人,著名作家,还是悉尼大学的音乐学博士。

  • spring理念:使现有的技术更加容易使用,本身是个大杂烩,整合了现有的技术框架!

  • SSH:Struts2 + Spring + Hibernate

  • SSM:SpringMvc + Spring + Mybatis

阅读全文 »

引入

继之前的多项式回归,如果 degree 设置过大或者过小会出现什么样的问题呢?

在此之前,先来说明一下 归一化 的必要性。多项式回归采用了特征组合的方式,当 degree 为100时,最高次就是100次,而最低次只是常数级,各个维度数值之间的跨度非常大,这就导致 eta 必须设置得非常小,否则稍大一点,就会无法拟合,变成 nan

当 degree 为10时, eta就必须设置成$10^{-19}$,很不利于我们训练模型,所以在数据与距离阶段除了要多项式化还得归一化!

根据上述要求,改进了一下多项式回归的类。

1
2
3
4
5
6
7
8
9
10
11
12
13
14
15
16
17
18
19
20
21
22
23
24
25
26
27
28
29
30
31
32
33
34
35
36
37
38
39
40
41
42
43
44
45
46
47
48
49
50
51
52
53
54
55
56
57
58
59
60
61
62
63
64
65
class PolynomialRegression:

def __init__(self, degree):
self.degree = degree

def fit(self, X, y, eta = 0.01, n_iters = 1e4, epsilon = 1e-6):
self.X = self._getPolynomialFeatures(X, 0, np.ones([len(X), 1]), self.degree)
self.X = self.standardization(self.X)

initial_theta = np.zeros([self.X.shape[1]])
theta = self._gradient_descent(self.X, y, initial_theta, eta, n_iters, epsilon)
self.theta = theta
self.coefficient = theta[1:]
self.intercept = theta[0]

# 归一化
# 第一列全为1方差为0要单独处理,改成第一列全为0
def standardization(self, X):
return np.hstack([np.zeros([len(X), 1]), (X[:, 1:] - np.mean(X[:, 1:], axis = 0)) / np.std(X[:, 1:], axis = 0)])

# 多项式化
def _getPolynomialFeatures(self, X, start, col_val, degree):
def dfs(X, result, start, col_val, degree):
result.append(col_val)
if(degree == 0):
return

for i in range(start, X.shape[1]):
dfs(X, result, start, col_val * X[:, i].reshape([-1, 1]), degree - 1)

result = []
dfs(X, result, 0, np.ones([len(X), 1]), degree)
return np.squeeze(np.array(result), -1).T

# 预测也要多项式化和归一化
def predict(self, X):
X_b = self._getPolynomialFeatures(X, 0, np.ones([len(X), 1]), self.degree)
X_b = self.standardization(X_b)
y_pred = X_b.dot(self.theta)
return y_pred

# MSE
def score(self, X, y):
y_pred = self.predict(X)
return np.mean((y - y_pred) ** 2)

def _gradient_descent(self, X_b, y, theta, eta, n_iters, epsilon):

def J(X_b, y, theta):
return np.mean((X_b.dot(theta) - y) ** 2);

def DJ(X_b, y, theta):
return X_b.T.dot((X_b.dot(theta) - y)) * 2 / len(y);

i_iter = 0

while i_iter < n_iters:
gradient = DJ(X_b, y, theta)
last_theta = theta
theta = theta - eta * gradient
if np.abs(J(X_b, y, theta) - J(X_b, y, last_theta)) < epsilon:
break
i_iter += 1

return theta

当然直接使用 sklearn 中的 Pipeline 可以更加简便的实现这一切。

Pipeline 具体运作机制就是逐行运行,上一行的输出就是下一行的输入,因此我们先进行多项式化,再归一化,最后放入线性回归中训练模型。

1
2
3
4
5
6
7
8
9
10
11
12
13
from sklearn.pipeline import Pipeline
from sklearn.linear_model import LinearRegression
from sklearn.preprocessing import PolynomialFeatures
from sklearn.preprocessing import StandardScaler

def PolynomialRegression(X,y,degree):
pipeline = Pipeline([
("poly",PolynomialFeatures(degree = degree)),
("std_scaler",StandardScaler()),
("lin_reg",LinearRegression())
])
pipeline.fit(X,y)
return pipeline.predict(X)

数据拟合

先写一个绘制拟合曲线的函数便于我们观测结果。

1
2
3
4
5
6
7
8
9
def plot_matching_curve(X, y, degree, eta = 1e-6, n_iters = 1e5):
poly_reg = PolynomialRegression(degree)
poly_reg.fit(X, y, eta, n_iters)
theta = poly_reg.theta
pred_y = poly_reg.X.dot(theta)
plt.scatter(X[:, 0], y)
plt.plot(X[:, 0], pred_y, color = "r")
plt.show()
return poly_reg

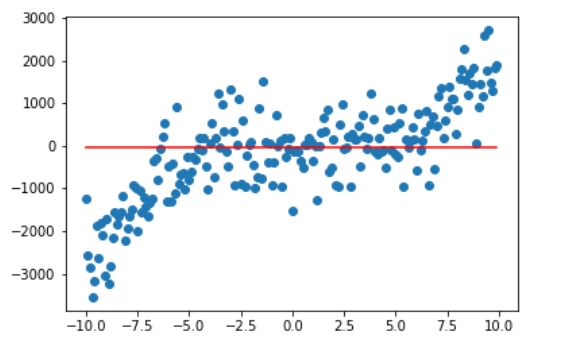
当 degree 为0时,也就是最高次为0次,拟合曲线成一条直线,这就是欠拟合。

毕竟函数只有一个常数嘛,合理。

1
plot_matching_curve(x.reshape([-1, 1]), y, 0)

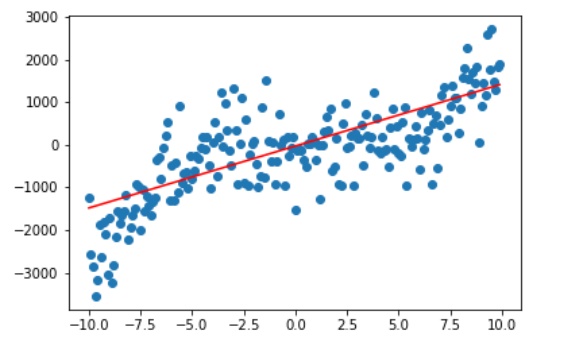
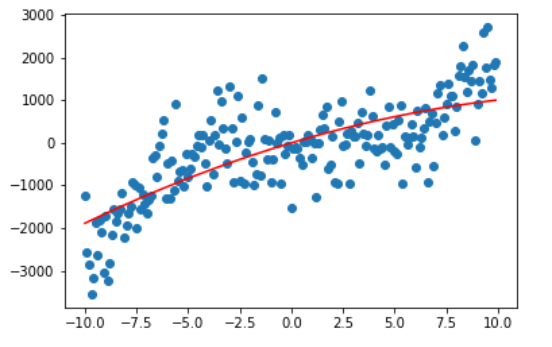
再来看看 degree 分别为1,2的情况,是不是越来越接近我们的拟合曲线了。

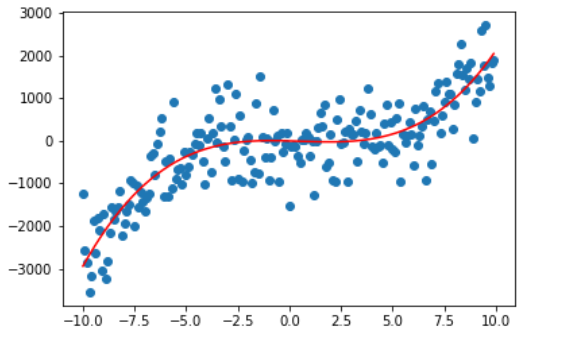
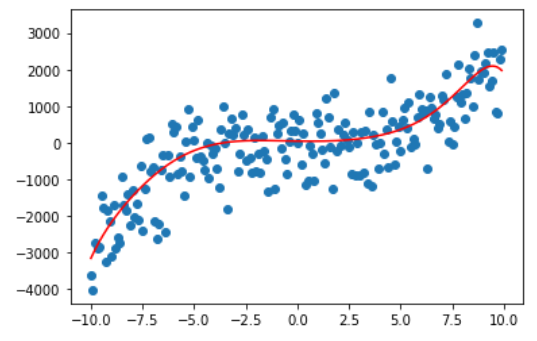
当 degree 为3时,曲线终于拟合了我们的数据。

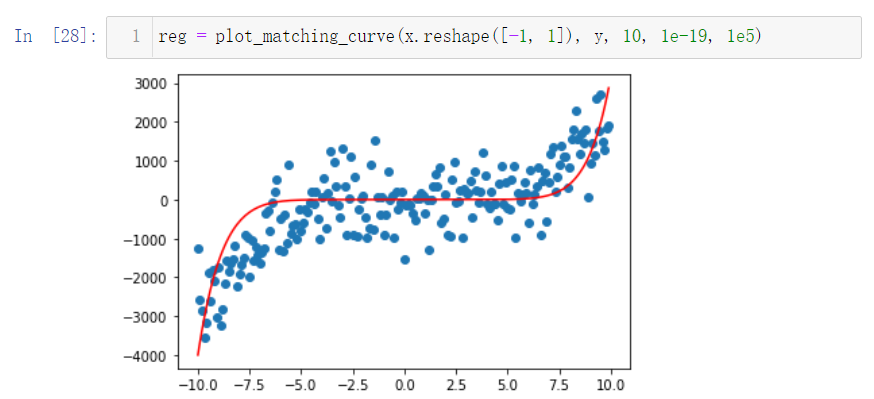
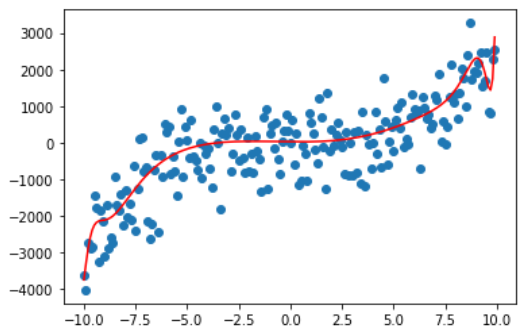
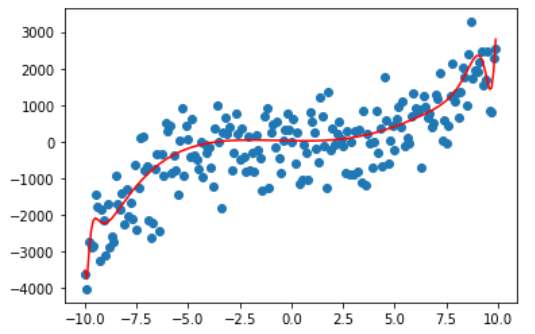
那我们再看看 degree 为10,50,100,200的情况。

很容易可以观察出,曲线变得越来越复杂,也越来越能拟合我们的训练数据,这是因为随着 degree 的增大,参数数量的增长使得我们的模型可以将训练的数据给记住,但这真的是我们想要的吗?

不,我们想要的是泛化能力,是在测试数据乃至之后模型上线后的真实数据上也能有非常好的预测能力。

之前也说过了,多项式化是阶乘式地增长,一旦 degree 过大,直接就会导致栈溢出。


学习曲线

通过观察学习曲线,也可以帮助我们判断出模型是否有过拟合或欠拟合的情况。它是绘制模型在训练集和测试集上的性能函数。

1
2
3
4
5
6
7
8
9
10
11
12
13
14
15
16
17
18
19
20
21
22
23
24
25
26
27
28
29
30
from sklearn.model_selection import train_test_split
from sklearn.pipeline import Pipeline
from sklearn.preprocessing import StandardScaler, PolynomialFeatures
from sklearn.linear_model import LinearRegression

def get_poly_reg(degree):
return Pipeline([
("poly", PolynomialFeatures(degree = degree)),
("std", StandardScaler()),
("reg", LinearRegression())
])

def plot_learning_curve(X, y, degree):
train_mse = []
test_mse = []
X_train, X_test, y_train, y_test = train_test_split(X, y)
poly_reg = get_poly_reg(degree)

for i in range(2, len(X) + 1):
poly_reg.fit(X_train[:i], y_train[:i])
train_pred = poly_reg.predict(X_train[:i])
test_pred = poly_reg.predict(X_test)
train_mse.append(np.mean(np.square(train_pred - y_train[:i])))
test_mse.append(np.mean(np.square(test_pred - y_test)))

plt.plot(np.arange(2, len(X)+1), train_mse, label="train")
plt.plot(np.arange(2, len(X)+1), test_mse, label="test")
plt.legend()
plt.axis([0,100,0,5])
plt.show()

这次我们把目标函数换成二次函数。

1
2
X = np.random.uniform(-3,3,size=100).reshape(-1,1)
y = 0.5 * X**2 + X + 4 + np.random.normal(0,1,size = 100).reshape(-1,1)

degree = 1

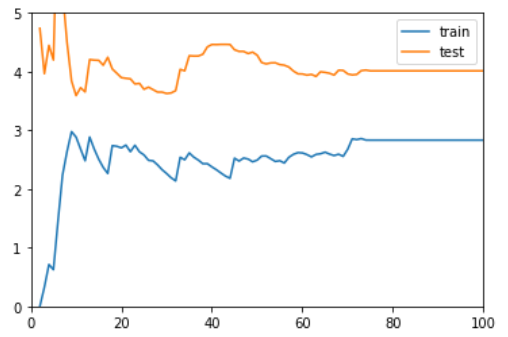
随着样本数量的增加 test 的误差在减小,train 的误差在增加,而当样本到了一定程度后,两者也没有保持在一个较小的程度上。这时说明模型欠拟合。

degree = 2

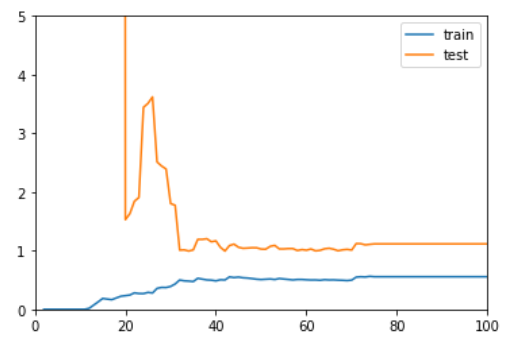
随着样本数量的增加 test 的误差在减小,train 的误差在增加,而当样本到了一定程度后,两者基本持平,保持在一个较小的程度上。这时模型已经拟合。

degree = 10

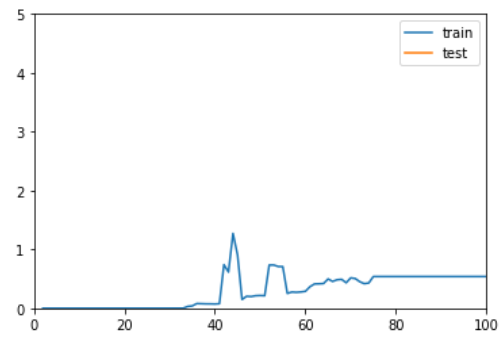
随着样本的增加 test 的误差在减小,train 的误差在增加,但当样本到了一定程度后,在 train 上的误差要比在 test 上的误差小得多,这时就要注意是不是过拟合了。

degree = 100

此时 test 上的误差已经飙到天上去了,妥妥的过拟合。

总结

在训练数据集上表现良好,却在测试数据集上表现差劲的就是过拟合,这时候要降低参数数量。

而在训练数据集上表现就不尽人意的有可能是欠拟合(也有可能是模型压根不对等问题),这时候可以试试增大模型,增加参数数量。

算法思想

如果你的数据比直线更复杂怎么办?例如抛物线。显然 线性回归 无法胜任这个工作,但我们只需要稍加修改,将每个特征的幂次方作为一个新特征即可,大致与线性回归类似,不过是多元一次和多元多次的区别。

线性回归假设目标拟合曲线函数为$y = w_1x_1 + w_2x_2 + w_3x_3 + … + b$,其中 $w_n$ 为系数 $x_n$ 为特征。

而多项式回归假设目标拟合曲线为$y = w_1x_1^n + w_2x_1^{n-1}x_2 + w_3x_1^{n-2}x_2^2 + … + w_nx_2^n$,这里出于简便只写了两个未知数的情况。


实例

这里我用的是三次函数的图像外加了点噪声,用线性回归肯定是拟合不了的。

1
2
3
4
5
6
7
8
9
import matplotlib.pyplot as plt
import numpy as np
%matplotlib inline

x = np.arange(-10, 10, 0.1)
y = 2.6 * x ** 3 - 3.14 * x ** 2 - 8.8 * x + np.random.normal(0, 700, (200, ))

plt.scatter(x, y)
plt.show()

1
2
3
4
5
X = x.reshape([-1, 1])
X = np.hstack([X ** 3, X ** 2, X])
X_b = np.hstack([np.ones([len(y), 1]), X])
# X [200, 3]
print(X.shape)

如算法思想所述,梯度下降的代码是没有改变的,只是添加了特征的幂指数作为额外的特征值。

1
2
3
4
5
6
7
8
9
10
11
12
13
14
15
16
17
18
def J(X_b, y, theta):
return np.mean((X_b.dot(theta) - y) ** 2);

def DJ(X_b, y, theta):
return X_b.T.dot((X_b.dot(theta) - y)) * 2 / len(y);

def gradient_descent(X_b, y, theta, eta = 0.01, n_iters = 1e4, epsilon = 1e-6):
i_iter = 0

while i_iter < n_iters:
gradient = DJ(X_b, y, theta)
last_theta = theta
theta = theta - eta * gradient
if np.abs(J(X_b, y, theta) - J(X_b, y, last_theta)) < epsilon:
break
i_iter += 1

return theta
1
2
initial_theta = np.zeros(X_b.shape[1])
theta = gradient_descent(X_b, y, initial_theta, eta = 1e-6, n_iters = 1e5)

得出 theta = array([-12.65120346, 2.89719563, -3.12234806, -15.72650818])

也基本对应了我预设的函数系数[2.6, -3.14, -8.8]

注:theta 每一项分别对应了截距,$x^3$ 的系数,$x^2$ 的系数,$x$ 的系数。

1
2
3
4
pred_y = theta[1] * x ** 3 + theta[2] * x ** 2 + theta[3] * x + theta[0]
plt.scatter(x, y)
plt.plot(x, pred_y, color = "r")
plt.show()


代码实现

需要注意的是多项式化是成阶乘式的增长,比指数爆炸更可怕!

$\frac{(n + d)!}{d!n!}$,其中 n 为原本特征数,d 为最高次数。

1
2
3
4
5
6
7
8
9
10
11
12
13
14
15
16
17
18
19
20
21
22
23
24
25
26
27
28
29
30
31
32
33
34
35
36
37
38
39
40
41
42
43
44
45
46
47
48
49
50
51
52
53
54
55
56
57
58
59
60
61
62
63
64
65
66
67
68
69
70
71
72
73
74
75
class PolynomialRegession:

# 生成多项式特征
def generatePolynomialFeatures(self, X, degree):
self.degree = degree
if degree == 0:
return np.ones_like(X)

n = X.shape[1]
ans = np.array(X)
if n > 1:
for i in range(n):
ans = np.hstack([ans, (X[:, i] ** degree).reshape(-1,1)])
for j in range(i+1, n):
for k in range(1, degree):
ans = np.hstack([ans, (X[:, i] ** k * X[:, j] ** (degree - k)).reshape(-1,1)])
else:
for k in range(2, degree + 1):
ans = np.hstack([ans, X ** k])

return np.hstack([ans, np.ones(ans.shape[0]).reshape([-1, 1])])

# 均值方差归一化 -> avg = 0, std = 1
def standardization(self, X):
tmp = X[:, :-1]
return np.hstack([(tmp - np.mean(tmp, axis=0)) / np.std(tmp, axis = 0), np.ones([len(X), 1])])

# 使用MSE作为损失函数
def f(self, X_b, y, theta):
return np.mean((X_b @ theta - y) ** 2)

# 损失函数的导数
def df(self, X_b, y, theta):
return X_b.T @(X_b @ theta - y) * 2 / len(y)

# 梯度下降
def gd(self, X_b, y, theta, eta = 0.01, n_iters = 1e4, epsilon = 1e-6, plot_process = True):
i_iter = 0

while i_iter < n_iters:
if ((plot_process and (i_iter + 1) % 1000 == 0) and (i_iter + 1) <= 10000) or (i_iter + 1) == n_iters:
display.clear_output(wait=True)
plt.scatter(x, y1)
plt.plot(x, (X_b @ theta).reshape(x.shape), c="green", label = 'predict')
plt.plot(x, y2, c="red", label = 'truth')
plt.legend()
plt.title("degree = " + str(self.degree))
plt.show()
plt.pause(0.5)

gradient = self.df(X_b, y, theta)
last_theta = theta
theta = theta - eta * gradient
if abs(self.f(X_b, y, last_theta) - self.f(X_b, y, theta)) < epsilon:
break
i_iter += 1

return theta

# 拟合
def fit(self, X, y, degree, eta = 1e-4, n_iters = 1e4, epsilon = 1e-6, plot_process = True):
self.X_b = self.generatePolynomialFeatures(X, degree)
self.X_b = self.standardization(self.X_b)
initial_theta = np.zeros_like(self.X_b[1])
self.theta = self.gd(self.X_b, y, initial_theta, eta=eta, n_iters=n_iters, epsilon=epsilon, plot_process=plot_process)
self.coefficient = self.theta[:-1]
self.intercept = self.theta[-1]

# 预测
def predict(self, X):
return self.standardization(self.generatePolynomialFeatures(X, self.degree) @ self.theta)

# 预测分析
def score(self, X, y):
return np.mean((predict(X) - y) ** 2)

测试

1
2
3
4
5
6
7
8
poly_reg = PolynomialRegression(3)
poly_reg.fit(x.reshape([-1, 1]), y, eta = 1e-6, n_iters = 1e5)

theta = poly_reg.theta
pred_y = theta[3] * x ** 3 + theta[2] * x ** 2 + theta[1] * x + theta[0]
plt.scatter(x, y)
plt.plot(x, pred_y, color = "r")
plt.show()

结果如出一辙。